

Cloud Resource Leaks Explained: Fix Hidden Costs & Reduce Cloud Spend:
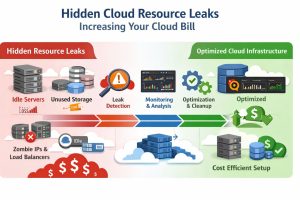
Managed cloud infrastructure resource leaks are subtle, systemic inefficiencies where provisioned assets like orphaned storage, idle compute instances, or unoptimized network configurations continue to incur charges without providing operational value. Identifying these leaks matters because they can inflate monthly expenditures by 30% or more, directly eroding the ROI of cloud migration and creating performance bottlenecks. This guide solves the problem of “bill shock” by providing a deep-engineering framework to audit, diagnose, and remediate hidden leaks using professional monitoring and DevOps practices
Understanding the Anatomy of a Cloud Resource Leak
In a production environment, a resource leak is rarely as obvious as a server crash; instead, it is a slow “drain” of capital and performance. From an infrastructure engineering perspective, resource leaks occur when engineers fail to align lifecycle management with the actual usage of resources. For example, a DevOps engineer may provision a high-performance SSD volume for a temporary database migration but forget to delete it after terminating the instance. As a result, the cloud provider continues charging for that IOPS-optimized storage.
These leaks often hide in the “gray zones” of managed cloud support, such as snapshot accumulation or over-provisioned load balancers that remain active long after a marketing campaign has ended. Unlike a memory leak in a C++ application that consumes RAM until the process dies, an infrastructure leak consumes budget and metadata overhead indefinitely. Understanding this concept requires shifting from a “set it and forget it” mindset to a continuous observability model where every provisioned asset must justify its hourly cost through active telemetry.
Why Hidden Resource Leaks Occur in Production
The root cause of most infrastructure leaks is the lack of automated lifecycle policies and the inherent complexity of multi-cloud environments. In many fast-scaling organizations, the speed of deployment is prioritized over the hygiene of decommissioning. When teams use “Infrastructure as Code” (IaC) without strict state-file management, resources can become “orphaned” existing in the cloud console but no longer tracked by the deployment scripts. This creates a disconnect where the billing department sees an active resource that the engineering team believes was deleted months ago.
Another common driver is “provisioning creep,” particularly in Linux server management services where legacy kernels or older PHP/Node.js versions are kept active “just in case.” Engineers often fear that deleting a specific disk partition or a secondary network interface might break a dependency, leading to a culture of hoarding virtual resources. Furthermore, many managed cloud support providers focus solely on uptime rather than cost-efficiency, meaning they will keep a high-CPU instance running to ensure stability, even if a smaller, cheaper instance would suffice for the actual load.
The Engineering Framework for Diagnosing Leaks
Engineers investigate these issues by moving from the macro-billing level down to the micro-resource level. The process starts with a “Cost-to-Utilization” cross-reference. We look for resources where the cost is high but the “heartbeat” measured in CPU utilization, disk I/O, or network throughput is near zero. Tools like AWS Cost Explorer or Azure Advisor provide the initial red flags, but a senior engineer uses deep-packet inspection and system-level monitoring to confirm that a resource is truly redundant before pulling the plug.
Once a potential leak is identified, the next step is a dependency audit. This involves checking if an idle EBS volume is attached to a stopped EC2 instance or if an Elastic IP is sitting unattached, racking up hourly “idle” fees. For Linux environments, we often use shell scripts to query the cloud provider’s API and cross-reference active processes with provisioned hardware. If a 16-core server shows a consistent load average of 0.05 over a 30-day period, it is a clear candidate for downscaling or consolidation within our managed cloud infrastructure management services.
Real-World Production Scenarios and Remediation
In a high-traffic production environment, one of the most frequent “leaks” involves snapshot proliferation. Companies often implement policies to take daily backups of their database volumes, but when they fail to enforce retention policies through automated lifecycle hooks, they end up paying for thousands of outdated snapshots accumulated over years. Infrastructure engineers resolve this issue by implementing automated cleanup Lambda functions or by using native tools like AWS Lifecycle Manager to retain only the last 30 days of data, significantly reducing storage overhead.
Another scenario involves “Zombie Assets” in a multi-region deployment. A team might test a failover strategy in a secondary region, provision several Load Balancers and NAT Gateways, and then forget to tear them down after the test. Because these assets often have a flat hourly rate regardless of traffic, they act as a constant leak. Our 24/7 NOC services catch these by setting “Anomalous Spend” alerts; if a region that usually costs $10/day suddenly jumps to $50/day without a corresponding increase in traffic, the on-call engineer is alerted to investigate and terminate the idle gateways.
Tools of the Trade: Monitoring and Observability
To maintain a leak-free environment, professional infrastructure teams rely on a stack of sophisticated monitoring tools. For metric collection, Prometheus and Grafana are the industry standard for real-time visibility into CPU spikes, memory leaks, and disk saturation. These tools allow us to create dashboards that visualize “Waste Metrics,” showing exactly how much provisioned capacity the application layer actually utilizes. When we integrate these metrics with Zabbix or Nagios, the system triggers immediate alerts for under-utilized server resources. This automated feedback signals an immediate need for rightsizing, allowing our infrastructure team to reclaim wasted budget instantly.
Beyond basic monitoring, modern DevOps infrastructure management utilizes “Cloud Governance” tools like CloudHealth or Kubecost. These platforms provide granular visibility into container-level spending, allowing engineers to see which specific Kubernetes pod is over-requesting memory. By setting “Requests” and “Limits” accurately in the deployment manifest, we prevent “Resource Slack,” where the cloud provider reserves hardware for a container that never actually uses it. This proactive engineering approach transforms cloud management from a reactive “fixing things when they break” model to a proactive “optimization-first” strategy.
Impact on Performance, Security, and Business Bottom Line
Identifying leaks is not just about saving money; it is a critical security and performance practice. Orphaned resources are often unmonitored and unpatched, making them prime targets for attackers who look for “forgotten” instances to use as jump boxes into a private network. By cleaning up these hidden leaks, we reduce the attack surface of the entire cloud infrastructure. From a performance standpoint, over-provisioning can lead to “noisy neighbor” issues in shared environments, where an unoptimized, idle resource still consumes metadata and API rate limits from the cloud provider’s control plane.
For a business, the impact of managed cloud support that ignores resource leaks is a steady decline in margins. As the infrastructure grows, the waste grows exponentially. By partnering with experts who provide outsourced hosting support, companies ensure that their technical debt doesn’t turn into financial debt. A lean, optimized cloud environment is more agile, easier to migrate, and significantly faster to recover during a disaster because there is less “cruft” to replicate to the DR site.
Comparison: DIY Management vs. Professional Managed Support
Managing cloud costs internally often leads to “Alert Fatigue,” where engineers become desensitized to billing warnings or simply don’t have the time to investigate a $50/month leak when a $10,000/hour outage is looming. In contrast, professional 24/7 NOC services are dedicated specifically to the health and efficiency of the environment. While an internal team might check the bill once a month, a managed service provider uses real-time automated tools to catch a resource leak the moment it occurs.
Furthermore, Linux server management services bring a depth of OS-level knowledge that standard cloud tools lack. A cloud provider might tell you a server is at 90% memory usage, but a seasoned Linux engineer can log in and see that the memory is actually just sitting in “cached” or “buffer” status meaning the server is actually healthy and doesn’t need an expensive upgrade. This level of nuanced engineering prevents the “throw money at the problem” approach that often characterizes unmanaged cloud growth.
Case Study: Slashing 35% Off a SaaS Provider’s Monthly Bill
A mid-sized SaaS company recently approached our team because their monthly cloud bill had doubled over six months without a corresponding increase in users. Our initial audit using Prometheus and cloud-native billing APIs revealed that 22% of their spend was going toward “Unattached Elastic Block Store (EBS) Volumes.” These were remnants of an abandoned testing project that had been running for nearly half a year.
We also discovered that the team had configured the auto-scaling group too aggressively, causing it to spin up new instances based on minor CPU fluctuations instead of sustained load. By recalibrating their scaling policies and implementing a strict tagging and cleanup script for their DevOps infrastructure management, we were able to terminate over 40 idle instances and thousands of orphaned snapshots. Within 45 days, the client saw a 35% reduction in their total cloud spend while simultaneously improving application response times due to better resource distribution.
Quick Summary
Cloud resource leaks are hidden costs generated by orphaned storage, idle instances, and over-provisioned network assets. These inefficiencies occur due to poor lifecycle management and a lack of granular monitoring. Infrastructure engineers solve these leaks by using observability tools like Prometheus and Nagios to cross-reference billing with actual utilization, implementing automated cleanup scripts, and rightsizing instances to match real-world demand. Eliminating these leaks improves security, optimizes performance, and significantly reduces monthly cloud expenditures for businesses using managed cloud infrastructure.
Struggling with Traffic Spikes and Downtime?
Partner with our experts for reliable cloud auto-scaling, proactive monitoring, and high-availability infrastructure solutions.
Conclusion: The Business and Engineering Impact
Cloud adoption promises elasticity and cost savings, but without rigorous infrastructure management, businesses often experience uncontrolled spending. Identifying hidden resource leaks is a fundamental requirement for any modern enterprise. By adopting a “Cost-Aware DevOps” culture and leveraging professional outsourced hosting support, businesses can ensure their infrastructure is a lean, high-performance engine for growth. In the end, the most expensive cloud is not the one with the most power, but the one with the most waste.


