
AWS infrastructure monitoring involves tracking resource utilization, application performance, and security events through specialized tools like Amazon CloudWatch and AWS X-Ray. Engineers implement these strategies to ensure high availability, optimize costs, and resolve performance bottlenecks before they impact users. Effective monitoring provides the visibility required to maintain 99.99% uptime in complex cloud environments.
Quick Summary: AWS Infrastructure Monitoring at a Glance
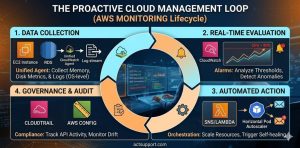
AWS infrastructure monitoring provides real-time insights into server health, network traffic, and database performance. By utilizing AWS CloudWatch metrics, engineers can set automated alarms for high CPU usage or memory exhaustion. Advanced strategies incorporate AWS Config for compliance and CloudTrail for auditing API activity. These tools allow technical teams to transition from reactive troubleshooting to proactive maintenance, ensuring that cloud environments remain stable under heavy production loads.
Why AWS Infrastructure Monitoring is Critical for Stability
Modern cloud environments rely on hundreds of moving parts, including EC2 instances, RDS databases, and S3 buckets. Without a robust AWS infrastructure monitoring strategy, a single misconfiguration can lead to catastrophic downtime. Monitoring acts as the “nervous system” of your cloud deployment. It identifies “silent failures”—issues like a slow memory leak or a saturated disk I/O—that do not immediately crash the server but degrade user experience over time.
Infrastructure failure often stems from resource exhaustion or neglected security patches. For example, if an EC2 instance runs out of inodes, the system will stop accepting new files even if disk space appears available. Monitoring tools alert engineers to these edge cases. By implementing proactive server monitoring services, businesses ensure that their infrastructure automatically scales or heals itself based on real-world demand and error rates.
Diagnosing Performance Gaps: How Engineers Identify Production Issues
Engineers diagnose cloud issues by correlating high-level CloudWatch alarms with low-level system logs. When a “Status Check Failed” alert triggers for an EC2 instance, we immediately investigate the underlying hypervisor or OS health. This involves checking the AWS Management Console for hardware failures while simultaneously logging into the instance via SSH to run diagnostic commands. We look for hardware interrupts, high load averages, or zombie processes that consume critical cycles.
Effective diagnosis requires deep technical visibility. We often see situations where an application slows down due to database connection pooling issues. By monitoring RDS “DatabaseConnections” alongside “CPUUtilization,” we can pinpoint if the bottleneck is the compute power or the application’s configuration. This multi-layered approach prevents the “blame game” between developers and sysadmins, leading to faster MTTR (Mean Time to Recovery).
Technical Evidence: Investigating System Health via CLI
To check for disk I/O bottlenecks on a Linux AWS instance:
iostat -xz 1 5To check system logs for OOM (Out of Memory) kills:
dmesg | grep -i "out of memory"
Step-by-Step: Implementing AWS Infrastructure Monitoring Strategies
Building a reliable monitoring stack requires a logical sequence of tool deployment and configuration. Follow these steps to secure your environment:
-
Enable CloudWatch Agent: Install and configure the Unified CloudWatch Agent on all EC2 instances to collect memory and disk metrics, which are not captured by default.
-
Configure Standard Alarms: Set threshold-based alarms for CPU > 80%, Memory > 85%, and Disk Space > 90%. Use SNS (Simple Notification Service) to send alerts to your NOC support team.
-
Audit API Activity with CloudTrail: Enable CloudTrail in all regions to track who made which change. This is essential for root cause analysis during security incidents.
-
Implement Dashboards: Create a centralized CloudWatch Dashboard that displays cross-account and cross-region metrics for a “single pane of glass” view.
-
Set Up VPC Flow Logs: Monitor network traffic to identify suspicious IP addresses or unauthorized access attempts to private subnets.
Comparing AWS Infrastructure Monitoring Approaches: CloudWatch vs. Zabbix
Selecting a monitoring tool depends on your specific infrastructure needs. Amazon CloudWatch is the native choice, offering seamless integration with all AWS services and requiring no server maintenance. However, it can become expensive at scale due to custom metric costs. For complex, hybrid environments, many system administration services prefer open-source tools like Zabbix or Nagios.
Zabbix offers superior historical data retention and more granular control over notification logic. It excels in environments where you manage a mix of on-premise hardware and cloud instances. However, native AWS tools are generally better for serverless architectures (Lambda) and managed services (RDS). Most enterprise-level organizations use a hybrid approach: CloudWatch for cloud-native metrics and a third-party tool for deep OS-level auditing and custom application logs.
Real-World Use Case: Detecting a DDoS Attack via Network Monitoring
A high-traffic e-commerce client experienced a sudden 400% spike in data egress costs. Their AWS infrastructure monitoring dashboard showed that while CPU was normal, “NetworkOut” metrics on their load balancer were off the charts. By analyzing VPC Flow Logs, our engineers discovered a massive volume of traffic originating from a specific botnet targeting a vulnerable API endpoint.
We immediately implemented an AWS WAF (Web Application Firewall) rule to block the malicious IP range. We then configured a new CloudWatch alarm to trigger if “BytesOut” exceeded a specific baseline within a 5-minute window. This proactive step prevented another cost spike and secured the client’s data. This scenario highlights why managed cloud support services are critical for identifying financial and security threats in real-time.
Best Practices: Proactive Maintenance and AWS Cloud Hardening
Infrastructure monitoring is only effective if you act on the data. Implement “Auto-Scaling” based on the metrics you collect. If CloudWatch sees a sustained 75% load, your environment should automatically provision new instances to distribute the weight. Furthermore, conduct regular “Game Day” simulations. Purposely break a service to see if your monitoring alarms trigger correctly and if your team knows how to respond.
Security hardening must be part of your monitoring routine. Use AWS Config to monitor for “Insecure Security Groups”—such as those with Port 22 open to the world (0.0.0.0/0). Integrating white label technical support into your monitoring workflow ensures that expert eyes are watching your alerts 24/7. This constant oversight prevents minor configuration drifts from turning into major security breaches or performance failures.
Struggling with Traffic Spikes and Downtime?
Partner with our experts for reliable cloud auto-scaling, proactive monitoring, and high-availability infrastructure solutions.
Conclusion
AWS infrastructure monitoring is the foundation of any scalable cloud strategy. By combining native AWS tools with expert system administration practices, you can ensure your applications remain fast, secure, and cost-effective. Proactive monitoring doesn’t just fix problems it prevents them. As cloud environments grow in complexity, the ability to observe, analyze, and act on infrastructure data becomes the ultimate competitive advantage for modern digital businesses.


