
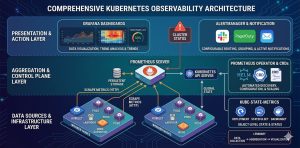
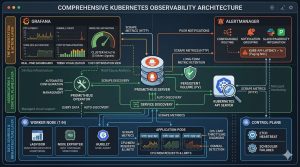
Kubernetes monitoring requires a multi-layered strategy to track the health of the control plane, worker nodes, and containerized workloads in real-time. Engineers must implement a unified observability stack primarily utilizing Prometheus and Grafana to collect metrics, logs, and traces for proactive troubleshooting. Effective monitoring ensures high availability, prevents resource exhaustion, and optimizes the performance of dynamic DevOps infrastructure.
Introduction: Why Observability Defines Kubernetes Success
Kubernetes transforms infrastructure into a fluid, automated environment, but this abstraction creates significant visibility gaps. Traditional monitoring fails here because IP addresses are ephemeral and containers disappear in seconds. Without a specialized Kubernetes monitoring guide, infrastructure teams cannot distinguish between a minor pod restart and a systemic cluster failure.
Obsability is the backbone of modern server management. It provides the data required for horizontal pod autoscaling (HPA), cost allocation, and security auditing. In high-stakes production environments, a robust monitoring framework acts as an early warning system, allowing teams to implement proactive monitoring before performance bottlenecks impact the end-user experience.
Quick Summary: Kubernetes Monitoring At a Glance
The following table summarizes the primary focal points for a production-grade observability stack.
| Layer | Primary Metrics | Recommended Tools |
|---|---|---|
| Control Plane | API Latency, Etcd Heartbeat, Scheduler Failures | Prometheus, CloudWatch |
| Node Layer | CPU/Memory Saturation, Disk I/O, PIDs | Node Exporter, Zabbix |
| Pod/Container | OOMKills, Restart Counts, CPU Throttling | cAdvisor, Kube-state-metrics |
| Application | Request Rate, Error Rate (5xx), P99 Latency | Grafana, Jaeger, Loki |
The Problem: Identifying Silent Failures in Production:
Engineers often face “silent” performance degradation where the cluster appears healthy but applications lag. A common root cause is CPU Throttling. This occurs when a container reaches its cpu.limits defined in the manifest. Unlike memory, the kernel does not kill the process; it simply restricts its access to the CPU cycles, causing massive latency spikes.
Another frequent issue is Control Plane Pressure. If the etcd database the cluster’s brain experiences high disk latency, the API server becomes unresponsive. This leads to a “split-brain” scenario where nodes cannot report their status, triggering unnecessary pod evictions and destabilizing the entire DevOps infrastructure.
Diagnosing with Commands and Evidence:
To identify if a pod is failing due to resource constraints, we examine the pod status using the following command:
kubectl get pods -n production -o wide
If a pod shows CrashLoopBackOff, we immediately check the lifecycle events. A Reason: OOMKilled indicates that the container exceeded its memory.limits. We verify this by inspecting the kernel logs on the host node:
journalctl -k | grep -i “out of memory”
If the logs show the kernel invoked the OOM Killer on a specific containerd process, the application requires memory optimization or a higher limit in its YAML configuration.
Step-by-Step Resolution: Implementing a Professional Stack
Building a scalable monitoring solution requires a structured deployment. We recommend the Prometheus Operator for its ability to automate configuration through Custom Resource Definitions (CRDs).
Step 1: Deploying the Monitoring Core
Standardize your environment by deploying the kube-prometheus-stack via Helm. This bundle includes Prometheus, Grafana, and Alertmanager, providing an end-to-end solution for server management.
Bash
helm repo add prometheus-community https://prometheus-community.github.io/helm-charts
helm install prometheus-stack prometheus-community/kube-prometheus-stack
Step 2: Configuring Service Discovery
Kubernetes is dynamic, so static scrape targets are useless. Use a ServiceMonitor to tell Prometheus exactly which labels to look for. This ensures that every new microservice is automatically tracked without manual intervention.
YAML
apiVersion: monitoring.coreos.com/v1
kind: ServiceMonitor
metadata:
  name: api-service-monitor
  labels:
    release: prometheus-stack
spec:
  selector:
    matchLabels:
      app: backend-api
  endpoints:
  - port: web
    interval: 30s
Step 3: Establishing Alerting Thresholds
Metrics are useless if no one reacts to them. Configure Alertmanager to trigger notifications based on “Golden Signals.” For example, a high priority alert should trigger if the apiserver_request_duration_seconds exceeds 1 second for more than 5 minutes. This ensures your 24/7 NOC services can intervene before the cluster becomes unmanageable.
Comparison Insight: Managed Cloud vs. Self-Hosted Monitoring
Deciding between native tools and third-party SaaS depends on your team’s operational capacity and budget.
-
Self-Hosted (Prometheus/Grafana): This is the gold standard for Linux server management. It offers total data sovereignty and zero licensing fees. However, it requires dedicated storage management (e.g., Thanos or Cortex for long-term retention).
-
Managed Cloud (AWS CloudWatch/Azure Monitor): Best for managed cloud support. These tools integrate deeply with the cloud provider’s hardware but can become prohibitively expensive at scale due to per-metric pricing.
-
Hybrid Approach: Many experts use Prometheus for short-term operational metrics and export critical data to a managed service for long-term backup and disaster recovery auditing.
GAIN COMPLETE VISIBILITY INTO YOUR KUBERNETES CLUSTERS
Are hidden Kubernetes bottlenecks causing pod crashes, latency spikes, and unpredictable production outages?
Modern Kubernetes environments fail silently when CPU throttling, OOMKills, network saturation, or control-plane latency go unnoticed. Our engineers help implement enterprise-grade Kubernetes monitoring using Prometheus, Grafana, Alertmanager, and proactive observability workflows to identify performance issues early, optimize cluster health, strengthen infrastructure reliability, and maintain high availability across production workloads.
Real-World Case Study: Resolving a Network Saturation Incident
A high-traffic financial application experienced intermittent 504 Gateway Timeouts. The web servers showed low CPU usage, and the database had no locked queries.
The Diagnosis: Using the kubectl top nodes command, we noticed that while CPU was low, the network bandwidth on one specific node was at 95% capacity.
Root Cause: A misconfigured “Logging Sidecar” was sending verbose debug logs to an external collector over an uncompressed stream. This saturated the node’s network interface (NIC), causing the kube-proxy to drop incoming requests for the main application.
Resolution: We modified the sidecar configuration to use GZIP compression and implemented a LimitRange for network egress. The timeouts disappeared, and the node’s network saturation dropped to 30%. This demonstrates why proactive monitoring must include the network layer, not just compute.
Best Practices: Server Hardening and Maintenance
To maintain a secure and efficient cluster, senior architects follow these production-focused rules:
-
-
Enforce Resource Requests: Always define
requests. This allows the Kubernetes scheduler to place pods correctly. Without them, the scheduler might oversubscribe a node, leading to massive performance degradation. -
Monitor the API Server: The API server is the gateway to the cluster. Monitor its latency religiously. If it slows down, your entire DevOps infrastructure stops responding to changes.
-
Implement Pod Disruption Budgets (PDB): Ensure that monitoring agents (like Prometheus replicas) are always available during cluster upgrades or node maintenance.
-
Use Persistent Storage for Metrics: Ensure Prometheus uses a Persistent Volume (PV). If the Prometheus pod restarts and uses ephemeral storage, you lose your historical data, making root cause analysis impossible.
-
Audit Logs for Security: Enable Kubernetes Audit Logging. This tracks “Who did what, when, and how.” Shipping these to a centralized platform is a key part of server hardening.
-
Conclusion: The ROI of a Managed Infrastructure
Kubernetes monitoring is not an “install and forget” task; it is a continuous engineering discipline. By shifting from reactive troubleshooting to proactive monitoring, organizations reduce downtime and increase developer velocity. A well-monitored cluster allows you to scale with confidence, knowing that your server management strategy is backed by hard data.
Investing in high-quality observability is the most effective way to ensure your DevOps infrastructure remains a competitive advantage rather than an operational burden.


