




What Linux server metrics should enterprises monitor 24/7?
Enterprise Linux monitoring should track CPU saturation, memory pressure, disk I/O, filesystem capacity, network behavior, process health, application latency, error rates, and resource pressure continuously.
The 15 most important metrics connect infrastructure behavior to application availability and help engineers identify failures before they become outages.
A production monitoring platform should measure both resource utilization and the time workloads spend waiting for constrained resources.
Why does enterprise Linux monitoring require more than CPU and RAM?
Enterprise Linux monitoring requires correlated infrastructure and application telemetry because individual utilization metrics rarely identify the complete failure path. A server can report 65% CPU utilization while applications experience severe latency because workloads wait on memory, storage, network, locks, or downstream services.
Linux Pressure Stall Information provides a particularly useful signal because the kernel measures how much time workloads spend stalled on CPU, memory, and I/O resources. The Linux kernel documentation explicitly identifies resource contention as a cause of latency spikes, throughput losses, and OOM risk.
Modern observability platforms should therefore combine operating-system metrics with application metrics, traces, events, and service-level indicators. OpenTelemetry’s current semantic conventions provide standardized naming and attributes for system, application, HTTP, database, Kubernetes, and other telemetry domains, making cross-system correlation easier.
1. How should enterprises monitor CPU utilization?
CPU utilization shows how much processor capacity workloads consume, but CPU utilization alone cannot prove that a Linux server is healthy. Administrators should correlate CPU usage with load, CPU pressure, run-queue behavior, process states, application latency, and workload type.
A server running at 85% CPU can remain healthy when the workload scales predictably and latency stays within its service objective. The same 85% CPU level can indicate a serious capacity problem when request latency, queue depth, or CPU pressure increases simultaneously.
Enterprise monitoring should distinguish user CPU, system CPU, idle CPU, I/O wait, steal time in virtualized environments, and workload-specific consumption. Steal time deserves particular attention on virtual machines because the guest operating system can appear busy or delayed when the underlying hypervisor allocates physical CPU resources elsewhere.
A practical starting point is to investigate sustained CPU utilization above approximately 80% rather than treating 80% as a universal failure threshold. Production teams should establish thresholds from historical workload behavior, application latency, and capacity headroom instead of copying arbitrary alert values between environments.
2. How does Linux load average reveal resource pressure?
Linux load average represents runnable or uninterruptible work and therefore provides information that raw CPU utilization does not provide. A high load average can indicate CPU contention, but Linux processes blocked in uninterruptible sleep, commonly associated with I/O activity, can also contribute to load.
The critical mistake involves comparing load average directly with a fixed number without considering CPU capacity. A load average of 8 has very different implications on a 2-vCPU virtual machine and a 32-core server.
Enterprise monitoring should normalize load against available CPU capacity and then correlate the result with CPU pressure, I/O latency, memory pressure, and application response time. Linux PSI improves this analysis because it directly measures the time workloads spend stalled on constrained resources.
3. How should administrators monitor CPU pressure?
CPU pressure measures how much time tasks spend waiting for CPU resources and can expose contention that conventional CPU utilization misses. Linux PSI separates resource-stall information from simple utilization and provides recent measurements over 10-second, 60-second, and 300-second windows.
This metric becomes especially valuable in oversubscribed virtual environments and high-density container hosts. A machine can show apparently acceptable average CPU utilization while latency-sensitive workloads experience repeated scheduling delays during short traffic bursts.
Enterprise teams should alert on sustained CPU pressure in combination with application latency rather than creating alerts from isolated spikes. A short pressure event may represent normal workload behavior, while persistent pressure indicates that the workload may require scaling, CPU allocation changes, workload isolation, or load shedding.
4. How should enterprises monitor memory utilization?
Memory utilization must include available memory, reclaim activity, swap behavior, cache usage, and memory pressure because Linux deliberately uses unused RAM for filesystem and other caches. Treating every cached byte as wasted memory produces misleading alerts.
A healthy Linux system can report high memory utilization while maintaining sufficient reclaimable memory. The more important question asks whether applications experience memory contention and whether the kernel spends excessive time reclaiming pages.
Linux PSI provides direct visibility into memory-related stalls and can reveal pressure before an OOM event becomes the primary symptom. The kernel documentation specifically connects resource contention with latency, throughput degradation, and OOM risk.
5. Why should enterprises monitor swap activity?
Swap activity can indicate memory pressure, but swap usage alone does not automatically indicate a performance failure. Linux can use swap strategically, and inactive memory pages may remain swapped without causing significant application impact.
Continuous swap-in and swap-out activity presents a stronger warning because the system must perform storage operations to satisfy memory access requirements. Excessive swapping can increase I/O latency and create a feedback loop in which memory pressure generates storage pressure.
Enterprise monitoring should therefore track swap-in and swap-out rates alongside memory PSI, available memory, storage latency, application latency, and OOM events. Administrators should investigate sustained activity rather than automatically disabling swap or treating any non-zero swap usage as an outage.
6. How should Linux disk I/O latency be monitored?
Disk I/O latency measures how long storage operations take and often exposes application performance problems before filesystem capacity alerts trigger. A database can remain fully operational while query latency increases because storage operations take longer to complete.
Administrators should monitor read latency, write latency, I/O operations per second, throughput, queue depth, and device utilization. These measurements become especially important for database servers, virtualization hosts, logging infrastructure, and workloads that generate large numbers of small random I/O operations.
The monitoring system should correlate storage latency with application response time because a storage subsystem can remain within its normal throughput range while individual requests experience unacceptable latency.
7. Why is filesystem capacity one of the most important Linux metrics?
Filesystem utilization must be monitored because a full filesystem can prevent applications from writing files, databases from extending data structures, logging systems from recording events, and services from creating temporary files.
A production monitoring policy should track both filesystem capacity and inode consumption. A filesystem can have free gigabytes while still failing new file creation because it has exhausted available inodes.
A practical warning threshold often starts around 80% capacity, with stronger escalation around 90%, but these values should remain policy-driven rather than universal. Fast-growing filesystems may require much earlier alerts because the available capacity can disappear before engineers can provision additional storage.
8. How should enterprises monitor Linux network performance?
Network monitoring should measure throughput, packet errors, packet drops, retransmissions, connection counts, latency, and interface saturation because bandwidth utilization alone cannot explain network failures.
Packet loss and retransmissions can create severe application latency even when an interface operates below its bandwidth limit. TCP reacts to congestion and packet loss by modifying transmission behavior, which can reduce effective application throughput without producing an obvious bandwidth-capacity alert.
Enterprise monitoring should correlate host-level network metrics with load-balancer statistics, firewall behavior, DNS latency, upstream network performance, and application response time. This correlation helps administrators distinguish a Linux network-stack problem from an upstream infrastructure failure.
9. Why should TCP connection states be monitored?
TCP connection states reveal abnormal connection behavior that CPU and memory dashboards cannot identify. Large increases in connections waiting for completion, connections closing, or established sessions can indicate application overload, client behavior, network problems, or resource exhaustion.
Enterprise administrators should establish workload-specific baselines for established connections, connection creation rates, connection failures, retransmissions, and socket utilization. A sudden deviation from the baseline can provide an early indication of a traffic surge or application dependency failure.
Connection monitoring becomes especially important for web servers, API gateways, database clients, reverse proxies, and high-concurrency applications where connection exhaustion can prevent otherwise healthy services from accepting new requests.
10. How should enterprises monitor application latency?
Application latency represents the time users and upstream services wait for an operation to complete and should remain one of the highest-priority enterprise monitoring signals. Infrastructure metrics explain why latency changes, but latency measures whether the workload actually experiences the resulting impact.
Administrators should monitor median latency together with p95, p99, and maximum latency when the monitoring system supports distribution metrics. Percentiles reveal tail behavior that averages can hide.
Prometheus supports counters, gauges, histograms, and summaries, while its current documentation recommends native histograms where practical for distribution-oriented measurements. Histograms allow teams to analyze request-duration distributions rather than relying only on averages.
OpenTelemetry also defines HTTP server metrics such as request duration and active requests, providing standardized telemetry concepts that can connect application behavior with infrastructure monitoring.
Keep Your Linux Infrastructure Healthy 24/7
Don’t wait for CPU saturation, memory pressure, disk latency, or application failures to become production outages.
Let experienced Linux engineers continuously monitor, troubleshoot, optimize, and protect your business-critical servers.
24/7 Monitoring •
Proactive Troubleshooting •
Performance Optimization •
Security Hardening •
Expert Linux Administration
Proactive Troubleshooting •
Performance Optimization •
Security Hardening •
Expert Linux Administration
Get 24/7 Linux Server Management
Protect uptime. Reduce operational risk. Keep your infrastructure performing.
11. Why should HTTP error rates be monitored?
HTTP error rates reveal application failures that operating-system monitoring cannot detect. A Linux server can remain completely reachable while its application returns 500, 502, 503, or 504 responses to customers.
Enterprise monitoring should separate client errors from server-side errors because a rise in 4xx responses can indicate authentication, routing, application validation, or client behavior while a rise in 5xx responses often requires investigation of application or infrastructure dependencies.
A useful alert strategy monitors the percentage of failed requests over a defined observation window rather than triggering an incident from one isolated response. Teams should establish service-specific error budgets and connect error-rate alerts to customer-impacting service-level objectives.
12. How should enterprises monitor process and service health?
Process and service health monitoring determines whether critical Linux workloads actually perform their intended functions. A server can report normal CPU, memory, disk, and network metrics while a required database, web server, message broker, or application process remains unavailable.
Monitoring should therefore verify both process existence and service functionality. A process-health check confirms that a process remains active, while an application health check verifies that the service can accept requests and return an expected response.
This distinction prevents false confidence from process-level monitoring. A web server process can remain alive while worker pools, database connections, certificates, upstream APIs, or application dependencies prevent successful transactions.
13. Why should enterprises monitor disk inode utilization?
Inode utilization measures filesystem metadata capacity and can expose failures that ordinary disk-space monitoring misses. Linux filesystems need an inode for each file and directory, so workloads that create millions of small files can exhaust inodes before consuming all available disk space.
Temporary files, email queues, cache directories, session files, container layers, application artifacts, and log fragments can produce rapid inode growth.
Enterprise monitoring should therefore track inode consumption as a separate capacity metric and correlate abnormal growth with the application responsible for file creation. This approach prevents administrators from repeatedly expanding storage when the actual constraint involves filesystem metadata rather than available bytes.
14. How should enterprises monitor system uptime and unexpected reboots?
System uptime provides operational context and helps identify unexpected restarts when correlated with boot events, service availability, kernel events, and infrastructure changes. Uptime alone does not prove reliability because a server can remain online while critical services repeatedly fail.
OpenTelemetry’s current system metric conventions define system.uptime as a recommended host-level metric and place operating-system host metrics within the system.* namespace.
Enterprise teams should correlate unexpected reboot events with kernel upgrades, hardware failures, virtualization events, cloud maintenance, power incidents, watchdog actions, and administrative changes. This correlation turns a simple uptime measurement into a useful reliability signal.
15. How should enterprises monitor Linux resource pressure and saturation?
Resource saturation represents one of the most important signals because infrastructure can remain technically available while workloads become unable to obtain resources quickly enough to meet application objectives. CPU, memory, and I/O pressure provide a more direct view of this condition than raw utilization alone.
Linux PSI reports some and full pressure states for CPU, memory, and I/O, allowing administrators to distinguish partial contention from conditions where all non-idle tasks experience simultaneous stalls. The kernel documentation notes that sustained full pressure represents thrashing and can have severe performance consequences.
Enterprise monitoring should use pressure metrics alongside application latency and throughput. This combination allows engineers to determine whether a latency increase originates from infrastructure contention or from another application-layer dependency.
How should enterprises combine these 15 Linux monitoring metrics?
Enterprise monitoring becomes effective when administrators correlate metrics instead of investigating each metric independently. CPU utilization should connect to CPU pressure, memory utilization should connect to memory pressure, disk utilization should connect to I/O latency, and application latency should connect to the infrastructure signals that can explain its change.
A useful monitoring hierarchy begins with business service availability, moves into application latency and error rates, then moves into infrastructure saturation, and finally reaches individual operating-system resources. This structure helps engineers start with customer impact and work backward toward the technical root cause.
OpenTelemetry’s semantic conventions exist specifically to create common names and attributes across telemetry, which improves correlation across applications, infrastructure, databases, HTTP services, and cloud environments.
What monitoring thresholds should Linux administrators use?
Monitoring thresholds should come from workload baselines and service objectives rather than universal percentage values. CPU at 80%, memory at 80%, or disk at 80% can represent completely different operational conditions across different applications.
Teams should define warning and critical thresholds using historical behavior, capacity headroom, application latency, error rates, and recovery time. A batch-processing server can tolerate a different CPU profile from a latency-sensitive API server, while a database server may require much tighter I/O latency controls than a static web server.
A practical starting model can use 80% for investigation, 90% for escalation, and 95% for urgent capacity review on selected capacity metrics, but these values should remain configurable policy defaults rather than claims of universal Linux health.
Why are percentiles better than averages for server monitoring?
Percentiles reveal tail latency that averages can hide. An API can report a 200 ms average response time while a meaningful subset of users experiences several-second delays.
P95 identifies the response time below which 95% of observations fall, while p99 identifies the corresponding 99th percentile. These measurements help enterprise teams understand whether a smaller population experiences severe performance degradation.
Prometheus histograms can represent distributions of observations such as request durations, while OpenTelemetry defines standardized HTTP request-duration metrics for service telemetry.
How should Linux monitoring work across AWS infrastructure?
AWS monitoring should combine native cloud metrics with operating-system and application telemetry because cloud-provider metrics do not automatically expose every Linux-level condition. Amazon CloudWatch provides time-series metrics for AWS resources and supports custom metrics for application and infrastructure data.
Amazon EC2 provides built-in metrics, while CloudWatch agents can provide additional operating-system information from Linux instances. AWS also offers detailed monitoring for supported services, with EC2 detailed monitoring publishing metrics at one-minute intervals compared with five-minute intervals for basic monitoring.
A mature AWS server management services strategy should therefore combine CloudWatch infrastructure signals with Linux-level CPU, memory, filesystem, process, network, application, and pressure metrics. This approach prevents cloud infrastructure from becoming a blind spot in enterprise monitoring.
What is the role of 24/7 server monitoring services?
Server monitoring services 24/7 provide continuous observation of infrastructure conditions and help organizations detect failures outside normal engineering hours. The value comes from combining monitoring, alert classification, escalation, investigation, and remediation rather than simply displaying dashboards.
A monitoring system should route alerts according to severity and ownership. A transient CPU spike may require no human intervention, while sustained memory pressure combined with rising application latency should trigger investigation and potentially automated remediation.
Enterprise operations should also distinguish monitoring from observability. Monitoring tells teams that known conditions crossed defined thresholds, while observability helps engineers understand unknown failure modes by correlating metrics, traces, logs, profiles, events, and contextual metadata.
How do Prometheus and OpenTelemetry improve Linux monitoring?
Prometheus provides a time-series monitoring model with metric types designed for counters, gauges, histograms, and summaries. This model works well for infrastructure and application measurements that need historical analysis, alerting, aggregation, and querying.
OpenTelemetry provides a broader telemetry framework that standardizes metrics, traces, logs, profiles, resources, and semantic attributes across application and infrastructure environments. Its semantic conventions help teams use consistent names and attributes when collecting telemetry from heterogeneous systems.
Enterprise architectures can therefore use Prometheus-compatible metrics alongside OpenTelemetry instrumentation rather than treating monitoring and application observability as completely separate systems.
What monitoring mistakes cause the most enterprise incidents?
The most dangerous monitoring mistake is collecting large volumes of telemetry without connecting the data to actionable service objectives. A dashboard containing hundreds of graphs does not automatically provide effective incident detection.
Another common failure occurs when teams monitor utilization but ignore saturation. CPU percentage, memory percentage, and disk percentage can remain within predefined ranges while applications experience latency caused by contention, network retransmissions, dependency failures, or queue buildup.
Alert fatigue creates another operational risk. When engineers receive too many low-value alerts, they become less responsive to genuine incidents. Enterprise teams should therefore design alerts around symptoms that require action and use dashboards for investigative context rather than turning every metric into an alert.
How should AI improve Linux server monitoring in 2026?
AI can improve Linux monitoring by correlating high-volume telemetry, identifying abnormal patterns, reducing repetitive investigation, and helping engineers prioritize incidents. AI should augment operational judgment rather than blindly execute production changes.
An AI-assisted monitoring system can compare current CPU, memory pressure, I/O latency, network behavior, application latency, and deployment events against historical baselines. It can then identify relationships that would require manual correlation across multiple dashboards.
The strongest implementation combines AI with deterministic monitoring rules. A service-level alert should remain based on an explicit operational condition, while AI can provide additional context, probable dependencies, anomaly explanations, and recommended investigation paths.
Lessons from the Field: How a Linux Monitoring Gap Can Hide a Production Failure
A production outage can develop even when conventional CPU and memory dashboards remain green. Consider a hypothetical enterprise API platform where application latency normally remains around 180 ms at p95 during business hours.
During a traffic surge, p95 latency increases from 180 ms to 1.4 seconds while average CPU utilization remains at 68%. A traditional monitoring system sees no CPU alert and therefore classifies the infrastructure as healthy.
The engineering team correlates application latency with Linux PSI, disk latency, memory pressure, TCP retransmissions, database response time, and request concurrency. The correlation shows that storage latency increases during the same intervals in which memory pressure rises, causing application workers to spend more time waiting for resources.
Linux PSI provides the missing signal because it measures actual time spent stalled on CPU, memory, and I/O resources rather than simply reporting utilization.
The architecture changes after the incident include workload isolation, additional application capacity, improved database storage, memory-pressure alerts, application latency SLOs, and correlation between infrastructure and application telemetry.
The key lesson is that enterprise monitoring should detect customer impact and resource contention together. Monitoring CPU utilization alone would have missed this failure because the CPU never approached the organization’s traditional alert threshold.
How should enterprises build a production Linux monitoring architecture?
A production monitoring architecture should collect host metrics, application metrics, service health, infrastructure events, and distributed telemetry into a correlated observability layer. The architecture should also retain enough historical data to establish baselines and investigate recurring incidents.
The collection layer should capture system CPU, memory, filesystem, network, disk, process, pressure, and uptime metrics. Application instrumentation should add request latency, active requests, error rates, database operations, queue depth, and dependency health.
OpenTelemetry’s system metric conventions include host-level metrics covering processor, memory, filesystem, network, uptime, and other operating-system signals, providing a useful standardized foundation for heterogeneous environments.
The alerting layer should prioritize service availability, latency, error rates, and resource saturation. The visualization layer should allow engineers to move from a business service to an affected application, then to the Linux host and finally to the underlying resource responsible for degradation.
How can enterprises reduce Linux monitoring noise?
Enterprises reduce monitoring noise by alerting on sustained abnormal conditions and customer-impacting symptoms instead of every metric deviation. A monitoring platform should distinguish informational telemetry, warning conditions, actionable incidents, and critical service failures.
Teams should also use multi-condition alerts where appropriate. For example, high memory utilization becomes more actionable when it coincides with rising memory pressure and application latency than when it occurs independently.
Prometheus supports aggregation and time-window analysis through PromQL, while its metric model allows teams to construct queries around counters, gauges, and distributions.
This approach helps engineers focus on conditions that require intervention instead of spending operational time responding to normal fluctuations.
Why should monitoring teams establish infrastructure baselines?
Infrastructure baselines provide the reference required to distinguish normal workload variation from Unusual behavior. Without a baseline, an administrator cannot reliably determine whether 60% CPU, 500 ms latency, or 5,000 TCP connections represent normal or abnormal operation.
Baselines should reflect business cycles because enterprise systems rarely maintain identical workloads throughout the day. Teams should account for weekday traffic, weekends, month-end processing, seasonal demand, scheduled jobs, deployment windows, and known maintenance periods.
AWS recommends establishing meaningful operational metrics and baselines and using deviations from those baselines to identify operational issues.
What does effective 24/7 Linux monitoring look like?
Effective 24/7 monitoring continuously connects infrastructure conditions with application behavior and business service health. It does not rely on one dashboard or one metric to determine whether an enterprise system is healthy.
A mature monitoring platform detects service availability problems, identifies latency degradation, measures resource saturation, correlates infrastructure dependencies, routes alerts to the correct team, and preserves enough historical data for root-cause analysis.
Organizations that lack internal operational coverage can use Linux server management services to extend monitoring and administration capabilities. ACTSupport provides server management services covering Linux administration, proactive monitoring, security hardening, performance optimization, backups, disaster recovery, and infrastructure support. ACTSupport Server Management Services
What should enterprises monitor first when building Linux observability?
Enterprises should start with service availability, request latency, error rates, CPU and memory pressure, storage latency, filesystem capacity, network health, process availability, and critical dependency health. These signals provide enough coverage to connect customer impact with common infrastructure failure modes.
Teams should then expand monitoring based on application architecture. Database-heavy workloads require database latency and connection metrics, container platforms require container and orchestration telemetry, and distributed applications require traces and dependency-level metrics.
OpenTelemetry’s current conventions cover system, HTTP, database, cloud, Kubernetes, runtime, and other telemetry domains, allowing monitoring architectures to expand without abandoning consistent telemetry namin
How does professional Linux monitoring support enterprise IT?
Professional monitoring reduces the operational gap between detecting an infrastructure problem and responding to it. Remote server management services can combine continuous monitoring with Linux administration, incident investigation, patch management, security controls, performance analysis, and escalation support.
The strongest managed model does not simply forward alerts to an external provider. It assigns clear ownership, defines response procedures, documents changes, maintains escalation paths, and measures operational performance through incident and service-level metrics.
For organizations operating hybrid infrastructure, cloud infrastructure management services can extend the same operational model across physical Linux servers, virtual machines, cloud instances, databases, containers, and cloud-native services.
What are the 15 most important Linux server monitoring metrics?
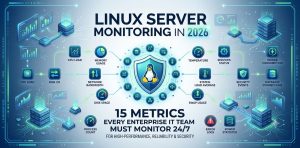
The 15 metrics covered in this guide are CPU utilization, Linux load average, CPU pressure, memory utilization, swap activity, disk I/O latency, filesystem capacity, network performance, TCP connection behavior, application latency, HTTP error rates, process and service health, inode utilization, system uptime, and overall CPU, memory, and I/O resource pressure.
These metrics should not operate as isolated dashboard widgets. Enterprise teams should correlate them with application behavior, deployment activity, cloud infrastructure events, database performance, and customer-facing service objectives.
The exact alert thresholds should remain workload-specific because Linux infrastructure behaves differently across databases, web servers, APIs, batch systems, virtualization hosts, containers, and cloud workloads.
How can ACTSupport help with 24/7 Linux server monitoring?
ACTSupport can provide continuous Linux infrastructure monitoring and administration for organizations that need additional operational coverage. Its server management offering covers proactive monitoring, Linux administration, security hardening, performance optimization, backups, disaster recovery, and infrastructure support. ACTSupport Server Management Services
If your internal IT team needs additional operational capacity, ACTSupport can act as an extension of the infrastructure team for monitoring, troubleshooting, maintenance, and escalation across business-critical Linux environments.