

Server Health Monitoring: Proactive Visibility for Production Uptime
Continuous server monitoring prevents downtime by identifying resource saturation before it triggers a system crash. We found that healthy infrastructure requires tracking four golden signals: CPU saturation, memory pressure, disk I/O latency, and network throughput. While real-time tools like htop and iostat help engineers troubleshoot immediate spikes, 24/7 visibility depends on automated metrics collection through platforms like Prometheus or Datadog.
To keep your environment stable, you should configure threshold-based alerts that notify your team before disks reach 90% capacity or swap usage indicates a memory leak. We found that log analysis in /var/log/messages often reveals the root cause of hardware failures that standard metrics miss. You should secure your uptime by running regular port audits with nmap and ensuring passive FTP ranges are open in your firewall to maintain seamless service connectivity.
How to Monitor Server Health 24/7
To monitor server health 24/7, engineers combine real-time Linux commands like top, iostat, and netstat with advanced monitoring tools such as Prometheus, Nagios, and Datadog. Continuous monitoring tracks CPU, memory, disk I/O, network activity, and service uptime. This approach helps engineers detect failures early, prevent downtime, and maintain performance in Linux server management services environments.
Understanding the Impact of Poor Server Monitoring on Production Uptime
Server monitoring directly impacts uptime, performance, and user experience. When engineers fail to monitor systems proactively, issues escalate into outages. High CPU usage, memory leaks, disk failures, or network congestion can silently degrade performance. In cPanel server management, shared environments amplify these issues because multiple tenants compete for resources. Without monitoring, engineers react late, increasing downtime and operational risk.
Key Takeaways for Infrastructure Engineers
Engineers maintain 24/7 server health monitoring by combining system-level commands and automated monitoring tools. They track CPU, memory, disk, and network metrics continuously. Logs provide historical insights, while alerts notify engineers of anomalies. Effective server hardening includes proactive monitoring to detect threats and performance issues before they impact production systems.
Root Cause Analysis: Why Servers Fail Without Monitoring
Servers fail due to resource exhaustion, hardware issues, and misconfigurations. The Linux kernel schedules processes and allocates resources dynamically. When CPU or memory reaches limits, processes queue or fail. Disk bottlenecks cause I/O wait, while network congestion delays communication. Without monitoring, these issues remain hidden until they cause service outages. Engineers must analyze system metrics continuously to prevent cascading failures.
Monitoring CPU Usage Using top and htop
CPU monitoring helps identify performance bottlenecks. Engineers use:
top
This command shows real-time CPU usage and process activity. High CPU usage indicates heavy workloads or inefficient processes.
htop
This tool provides a visual representation of CPU usage. Engineers identify processes consuming excessive CPU and take corrective action.
MONITOR SERVER HEALTH BEFORE FAILURES IMPACT UPTIME
Are hidden server issues causing unexpected downtime and performance drops?
CPU spikes, memory leaks, disk bottlenecks, and network failures can silently disrupt production infrastructure. Our engineers provide 24/7 server monitoring with proactive alerts, performance analysis, log monitoring, and infrastructure optimization to keep your systems stable and highly available.
Monitoring Memory Usage and Detecting Leaks
Memory issues cause application crashes and slow performance. Engineers use:
free -m
This command displays memory usage. Low available memory indicates potential issues.
vmstat 1
This command shows memory and swap activity. Continuous swap usage indicates memory pressure and possible leaks.
Monitoring Disk I/O Performance in Real Time
Disk performance directly affects application speed. Engineers use:
iostat -x 1
High await values indicate slow disk response.
df -h
This command checks disk usage. Full disks cause application failures and data loss.
Monitoring Network Activity and Detecting Bottlenecks
Network monitoring ensures smooth communication between services. Engineers use:
netstat -tulnp
This command shows active connections and listening ports.
tcpdump -i eth0
This command captures network traffic for analysis. Engineers detect anomalies such as DDoS attacks or unusual traffic patterns.
Using Logs to Identify System-Level Issues
Logs provide critical insights into server behavior. Engineers analyze /var/log/messages to identify system errors. Application logs reveal performance issues and failures. FTP logs such as /var/log/pure-ftpd.log help diagnose file transfer problems. Continuous log monitoring enables early detection of issues.
Verifying Port Accessibility Using telnet and nmap
Engineers verify service availability using network tools.
nmap -p 21,22 <server_ip>
This command checks if FTP and SSH ports are open.
telnet <server_ip> 21
This command verifies FTP connectivity. If ports remain closed, firewall rules or service failures cause the issue.
Step-by-Step Monitoring Setup Using FileZilla Logs
FileZilla provides detailed logs for FTP monitoring. Engineers enable debug mode to capture connection details. Logs reveal authentication failures, transfer errors, and connection issues. Analyzing these logs helps identify performance bottlenecks and configuration errors.
Step-by-Step Monitoring Setup Using WinSCP
WinSCP logs provide insights into file transfer operations. Engineers enable logging to capture detailed session information. Logs help diagnose permission issues, connection failures, and transfer delays. Proper log analysis ensures efficient troubleshooting.
Architecture Insight: Active vs Passive FTP Monitoring
Active FTP requires the server to initiate data connections, while passive FTP allows the client to initiate connections. Passive mode works better with firewalls because it avoids inbound connection restrictions. Engineers configure passive port ranges to ensure seamless file transfers. Monitoring FTP traffic helps identify connection failures and performance issues.
Real-World Use Case: CSF Firewall Blocking Passive Ports
A production server experienced FTP failures due to blocked passive ports. Engineers identified the issue using logs and network tools. They updated CSF firewall rules to allow passive port ranges.
csf -a <IP>
They configured passive ports in Pure-FTPd:
PassivePortRange 30000 35000
This fix restored FTP functionality and improved performance.
Advanced Monitoring Tools Engineers Use in 2026
Modern monitoring tools provide real-time insights and automation. Engineers use Prometheus for metrics collection, Grafana for visualization, and Datadog for cloud monitoring. Nagios provides alerting capabilities, while Zabbix offers comprehensive monitoring solutions. These tools integrate with infrastructure to provide continuous visibility.
Setting Up Alerts and Notifications
Alerts notify engineers of critical issues. Monitoring tools trigger alerts based on thresholds such as CPU usage or disk space. Engineers configure alerts to ensure immediate response to anomalies. Effective alerting reduces downtime and improves system reliability.
Server Hardening Through Continuous Monitoring
Continuous monitoring strengthens server hardening strategies. Engineers detect unauthorized access, unusual traffic, and performance anomalies. Monitoring tools integrate with security systems to provide comprehensive protection. This approach ensures stable and secure infrastructure.
FAQ: Server Health Monitoring
What is server health monitoring?
Server health monitoring tracks system performance metrics such as CPU, memory, disk, and network usage.
Why is 24/7 monitoring important?
Continuous monitoring detects issues early and prevents downtime.
How do engineers monitor server performance?
They use Linux commands and monitoring tools to track system metrics in real time.
What tools are best for server monitoring?
Prometheus, Grafana, Nagios, and Datadog are widely used tools.
How can I detect server issues early?
You can use alerts, logs, and monitoring tools to identify anomalies before they impact performance.
Authoritative Conclusion: Building Reliable Monitoring Infrastructure
Effective server health monitoring ensures high availability, performance, and security. Engineers must combine real-time commands, logs, and monitoring tools to maintain system stability. Organizations that invest in Linux server management services, cPanel server management, and 24/7 technical support achieve consistent uptime and operational efficiency.
Related Posts

May 30, 2026
How Do Virtual Data Center Support Services Ensure Enterprise Infrastructure Excellence and Reliability?
Summary: Virtual Data Center Support Services for Modern Enterprises Virtual Data Center Support plays a…

May 28, 2026
Dual-Core vs Quad-Core vs Hexa-Core vs Octa-Core: Which Processor is Best for Gaming in 2026?
Understanding Modern Processor Technology in 2026 The processor market has changed dramatically over the last…

May 23, 2026
How ActSupport Delivers 24×7 Server Management, Monitoring, and DevOps Support for High-Availability Infrastructure
Introduction: Why High Availability Fails in Real Infrastructure Modern infrastructure does not fail suddenly. It…

May 8, 2026
How to Choose and Configure a Dedicated Server? Complete Hardware, Security & Setup Guide
Quick Summary: The Dedicated Server Deployment Checklist Selecting and configuring a Dedicated Server in 2026…

May 7, 2026
How Do You Fix the “Bandwidth Limit Exceeded” Error and Prevent Website Shutdowns?
You fix the “509 Bandwidth Limit Exceeded” error by increasing the monthly data quota in…
May 7, 2026
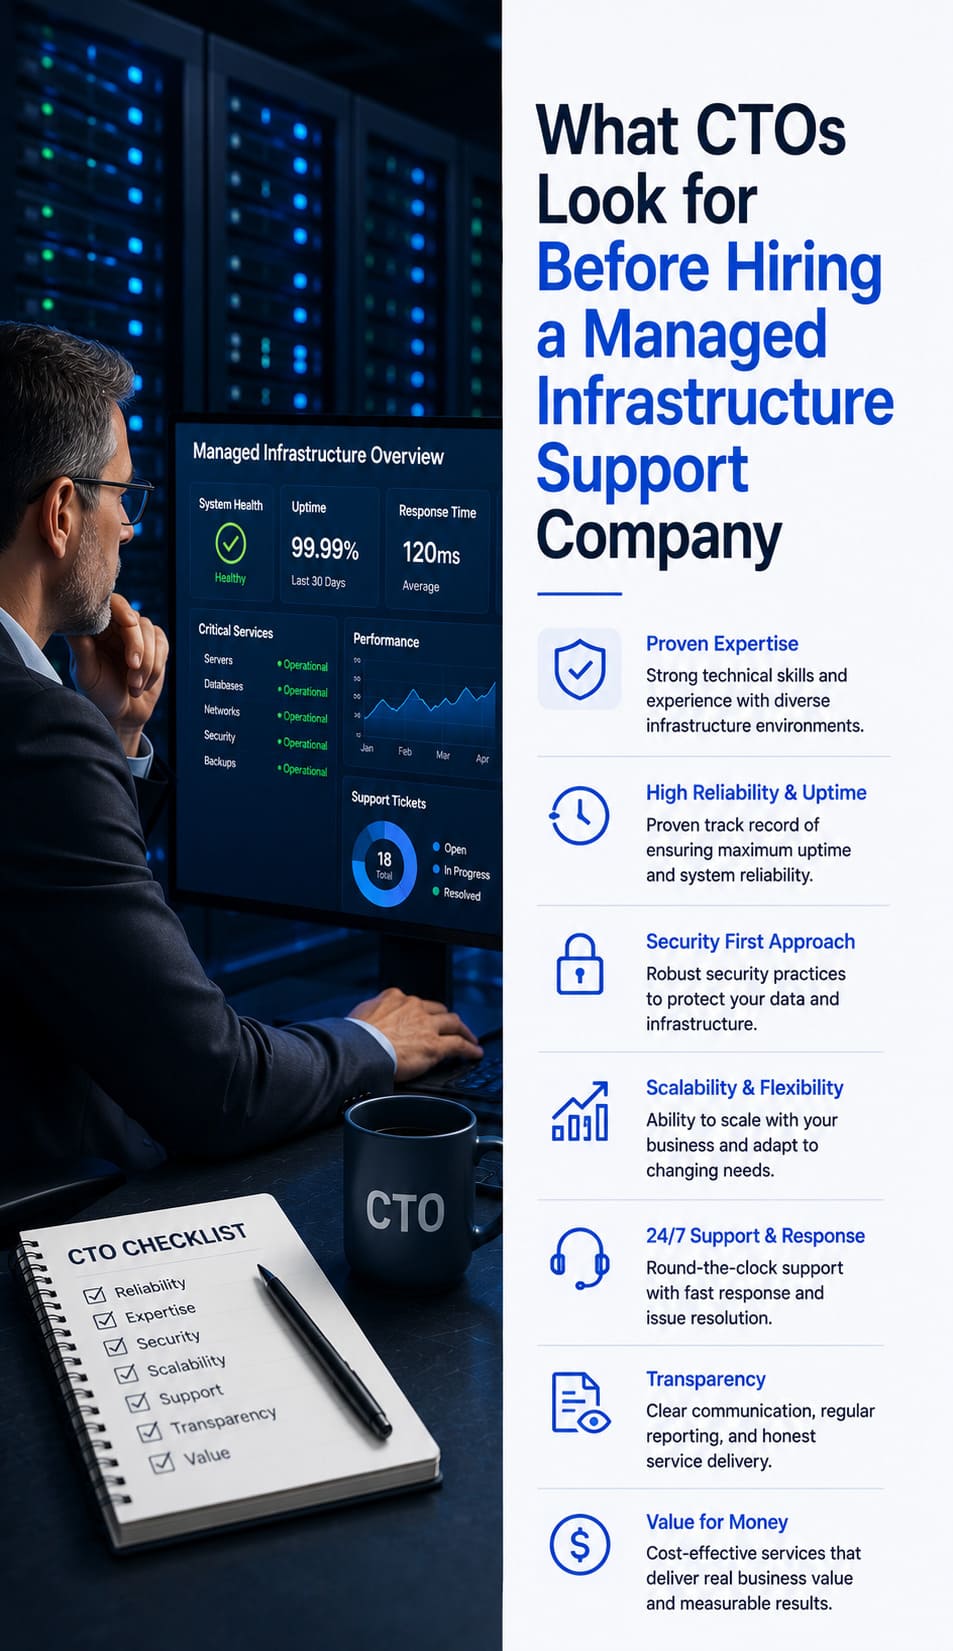
What CTOs Look for Before Hiring a Managed Infrastructure Support Company
Managed server support services require a high degree of technical competence and cultural alignment to…

May 2, 2026
Why Your Linux Server Is a Target for Bots? How to Block the Bots
Summary: Protecting Linux Servers from Bots & Brute Force Attacks Automated bots constantly scan the…

May 2, 2026
In-House vs Outsourced Server Management: Fixing High Server Costs & Downtime
Summary Managing infrastructure in-house often leads to rising server costs and unexpected downtime. This happens…


