




How Do You Monitor Windows Server Performance with Azure Monitor?
Windows Server performance monitoring uses Azure Monitor to collect and correlate CPU, memory, disk, network, Windows event, and application telemetry. This visibility helps infrastructure teams identify performance bottlenecks and investigate the underlying cause of slow workloads.
Azure Monitor can collect infrastructure and operating-system telemetry from Windows virtual machines and analyze it through Azure Monitor Metrics and Log Analytics.
Effective monitoring goes beyond watching CPU percentage because application latency can originate from memory pressure, storage delays, network dependencies, Windows services, or application-level problems.
Why Does Windows Server Monitoring Need More Than CPU Utilization?
Windows Server performance problems rarely originate from one resource alone. A server can report moderate CPU utilization while users experience slow applications because the workload is waiting on storage, a database, authentication service, API, or another dependency.
A CPU graph only describes processor utilization. It does not explain which process created the workload, whether the activity is normal for that server, or whether another resource is creating the actual delay.
Consider a Windows application that normally responds within 500 milliseconds but begins taking several seconds to complete requests. If CPU remains around its normal level while storage latency increases, adding CPU capacity will not address the underlying bottleneck.
The correct troubleshooting question is therefore not simply “Is CPU high?” It is “Which part of the workload changed, and what resource is responsible for the change?”
What Does Azure Monitor Collect from Windows Servers?
Azure Monitor can centralize operating-system and workload telemetry from supported Windows environments. Depending on the monitoring configuration, administrators can collect performance counters, Windows events, metrics, application telemetry, and other diagnostic information.
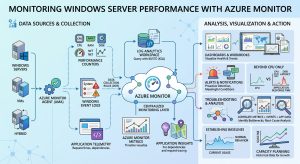
Microsoft’s current Azure Monitor architecture uses the Azure Monitor Agent and Data Collection Rules to define what telemetry should be collected, which machines should provide it, and where the collected data should be delivered.
Windows performance data can be delivered to a Log Analytics workspace, while guest metrics can also be exposed through Azure Monitor Metrics depending on the configured monitoring experience.
This architecture creates a central monitoring layer instead of forcing administrators to investigate every Windows server independently.
How Does the Azure Monitor Agent Fit into Windows Monitoring?
The Azure Monitor Agent is the collection component used to gather supported telemetry from monitored machines. Data Collection Rules determine the data sources, destinations, and collection configuration associated with the monitored systems.
A typical monitoring architecture follows this flow:
Windows Server → Azure Monitor Agent → Data Collection Rule → Azure Monitor / Log Analytics → Analysis → Alerts and dashboards
Microsoft also supports Azure Arc-enabled servers within its Azure Monitor scenarios, which extends centralized monitoring beyond Azure-hosted virtual machines.
The architecture matters because troubleshooting is only reliable when the monitoring pipeline itself is functioning correctly.
How Do You Verify That Windows Monitoring Is Actually Working?
A monitoring dashboard is useful only when the underlying telemetry is arriving correctly. Before investigating a performance incident, administrators should verify that the Azure Monitor Agent is provisioned successfully and that the expected machine is sending data.
Microsoft recommends checking the agent installation status and confirming heartbeat data in the Log Analytics workspace. A recent heartbeat provides evidence that the agent is communicating and sending telemetry.
If a server suddenly disappears from monitoring, administrators should first determine whether the monitoring agent, Data Collection Rule association, connectivity, or collection configuration changed before treating the absence of telemetry as a server failure.
How Should You Investigate High Windows Server CPU Usage?
High CPU utilization indicates processor demand, not necessarily a hardware shortage. The first step is to determine whether the utilization represents normal workload behavior or an abnormal change.
A Windows Server that normally operates around 30% to 50% CPU but suddenly remains near 90% has experienced a meaningful workload change. The investigation should focus on the process generating the demand and the event that triggered it.
Scheduled jobs, backups, antivirus scans, database operations, application workers, compilation tasks, traffic increases, and runaway processes can all increase CPU utilization.
The timing of the spike provides important evidence. A predictable spike at the same time every night points toward scheduled activity, while a gradual increase during business hours may indicate workload growth.
When Should You Avoid Increasing the Server’s CPU Capacity?
Infrastructure resizing should follow root-cause analysis rather than replace it. Increasing CPU capacity can reduce processor pressure, but it can also conceal a software or workload problem.
Before changing the VM size, determine whether CPU utilization is sustained, which process consumes the processor, whether the behavior repeats, whether a recent deployment changed the workload, and whether memory, disk, or network resources are also under pressure.
This approach prevents infrastructure teams from spending more on compute resources when the actual problem resides inside an application or scheduled workload.
How Do You Detect Windows Server Memory Pressure?
Memory pressure becomes important when available memory declines, paging increases, or one process continuously expands its working set. Administrators should examine memory behavior over time rather than rely on a single percentage reading.
A server with 90% memory utilization can operate normally if the workload consistently behaves that way and sufficient memory remains available for the required operations.
The situation changes when memory consumption continuously increases and the operating system begins relying heavily on paging. Paging moves memory data between RAM and storage, which can increase storage activity and application response time.
A gradual increase in memory consumption can also indicate an application memory leak, inefficient caching, abnormal workload growth, or a process that fails to release resources correctly.
Why Does Disk Performance Matter Even When CPU Looks Healthy?
Storage latency can make applications slow even when CPU and memory utilization appear normal. This makes disk analysis essential during Windows Server performance investigations.
Administrators should correlate storage latency, throughput, I/O activity, queue behavior, and available capacity with the period when users reported the problem.
Database workloads provide a common example. A database may issue large numbers of read and write operations and become storage-bound without producing extreme CPU utilization.
Backup jobs, antivirus scans, database maintenance, large file transfers, indexing, and application-generated temporary files can also create short periods of storage contention.
The important measurement is not simply whether disk activity is high. The important question is whether storage behavior changed at the same time as the application slowdown.
How Can Azure Monitor Help Identify Network-Related Performance Problems?
Network latency can make a healthy Windows Server appear slow. An application may spend most of its response time waiting for a database, API, authentication provider, remote storage system, or another service.
Administrators should correlate network activity with application response times and dependency behavior rather than automatically attributing slow responses to the Windows VM.
Unexpected increases in outbound traffic also deserve investigation when they do not correspond to normal application activity.
Network monitoring becomes particularly valuable in distributed architectures because the server handling a user request may depend on several systems outside the local operating system.
How Do Windows Event Logs Explain Performance Problems?
Windows Event Logs provide operational context that performance metrics cannot provide by themselves. CPU, memory, disk, and network metrics describe system behavior, while Windows events can reveal service failures, application errors, system events, authentication problems, or unexpected restarts occurring during the same period.
Azure Monitor Agent can collect Windows event logs through a Data Collection Rule and send them to a Log Analytics workspace. Microsoft supports collecting standard Windows logs such as System and Application and allows more granular event filtering through XPath-based configuration.
This correlation can transform a vague performance complaint into a specific investigation.
For example, an application slowdown that begins immediately after a Windows service failure provides substantially more diagnostic context than an isolated CPU graph.
Need Better Windows Server Performance Visibility?
Azure Monitor can show you where Windows Server resources are being consumed,
but effective monitoring also requires the right metrics, alert thresholds,
log analysis, and ongoing infrastructure management. ActSupport helps
businesses monitor, troubleshoot, and manage Windows server environments
before performance issues become service-impacting incidents.
From performance monitoring and resource analysis to proactive troubleshooting
and 24/7 infrastructure support, our engineers help maintain reliable and
production-ready server environments.
How Does Log Analytics Improve Multi-Server Troubleshooting?
Log Analytics gives infrastructure teams a centralized location for querying telemetry from monitored environments. Instead of opening Event Viewer or individual monitoring screens on every server, administrators can investigate collected data through a common analytical layer.
Kusto Query Language provides filtering, aggregation, correlation, and time-based analysis capabilities for Azure Monitor Logs.
The exact tables available depend on the configured data sources, so monitoring teams should design queries around the telemetry they actually collect rather than assuming that every environment contains the same datasets.
Microsoft maintains a current Azure Monitor data reference covering supported metrics, resource logs, Log Analytics tables, and sample queries.
What Should You Do When Server Metrics Look Normal but the Application Is Slow?
Normal infrastructure metrics do not prove that an application is healthy. A Windows Server can have normal CPU, memory, disk, and network utilization while an application experiences high response latency.
At that point, the investigation should move toward application and dependency telemetry.
Azure Monitor Application Insights provides application performance monitoring capabilities for supported workloads and can expose information about requests, failures, dependencies, and application behavior. Current Microsoft guidance also supports OpenTelemetry-based application observability for supported scenarios.
An application may spend most of its response time waiting for SQL queries, external APIs, internal microservices, authentication, remote storage, or another downstream dependency.
Adding CPU resources to the Windows VM will not necessarily resolve those conditions.
How Should You Configure Windows Server Performance Alerts?
A useful monitoring alert identifies a condition that requires investigation or action. An alert that fires constantly without requiring intervention creates noise and eventually reduces the value of the monitoring system.
Teams can create alerts around sustained resource pressure, missing telemetry, application failures, service conditions, and other operational signals supported by their monitoring configuration.
Azure Monitor supports alerts that can notify teams or trigger automated responses when defined conditions occur.
A practical alert should therefore represent a meaningful operational condition rather than an arbitrary metric threshold.
For example, a short CPU spike may be normal for a batch-processing server. A sustained CPU increase combined with application latency may deserve immediate investigation.
How Can Windows Server Performance Baselines Improve Troubleshooting?
A performance baseline defines what normal behavior looks like for a specific workload. Without a baseline, administrators often interpret individual metrics without enough historical context.
Suppose a business application normally operates between 35% and 50% CPU during working hours. A sustained increase to 80% or 90% represents a significant deviation from that server’s established behavior.
The same principle applies to memory, storage latency, network throughput, application response time, and request volume.
Baseline data also helps distinguish recurring operational patterns from unexpected incidents.
How Does Historical Monitoring Support Capacity Planning?
Historical performance data can reveal infrastructure growth before users experience a capacity problem. A server that gradually moves from an average 40% CPU workload to 65% over several months may indicate sustained workload growth rather than a temporary incident.
The same trend can occur with memory consumption, storage utilization, database activity, network traffic, and application request volume.
This information allows infrastructure teams to evaluate capacity changes using actual workload history instead of relying entirely on assumptions.
How Should You Control Azure Monitor Data Collection?
More telemetry does not automatically produce better monitoring. Excessive collection can increase data volume, cost, operational complexity, and investigation noise.
Microsoft’s current guidance recommends designing Data Collection Rules around the required data sources, target machines, and destinations. Microsoft also recommends keeping DCR organization practical because collection configuration affects management effort and resource consumption.
A monitoring team should therefore decide what information it needs before collecting it.
The right question is not “What can we collect?” but “What information will help us diagnose and operate this workload?”
What Does a Production Windows Performance Investigation Look Like?
A realistic Windows performance investigation requires correlation across infrastructure, operating-system, and application telemetry. Consider a simulated production incident in which users report that an internal business application becomes slow between 10:00 AM and 11:00 AM.
The initial infrastructure review shows CPU increasing from a normal 42% baseline to approximately 78%, while memory remains close to its established operating range.
Further analysis shows that storage latency also increases during the same period, while application response time rises from approximately 450 milliseconds to 2.4 seconds.
The investigation then identifies a scheduled data-processing workload running during the same window. The workload generates increased disk activity and additional application processing.
The remediation in this simulated scenario is not simply to increase CPU. The workload schedule is adjusted, storage performance is reviewed, and the application’s processing pattern is monitored during subsequent runs.
The key lesson is that correlation identifies the relationship between the symptom and the workload. CPU was elevated, but the performance investigation needed storage and application timing to explain why the application became slow.
How Should You Investigate a Windows Server That Suddenly Becomes Slow?
A repeatable investigation process reduces guesswork during production incidents. Start by identifying the affected server and the exact time window in which the problem occurred.
Compare CPU behavior with the server’s historical baseline rather than using a generic threshold.
Review memory consumption and paging to determine whether the operating system is experiencing memory pressure.
Examine disk latency and I/O behavior to identify storage contention.
Review network activity and application dependencies when the workload communicates with external or internal services.
Check Windows events for service failures, application errors, unexpected restarts, and other events occurring during the same period.
Move to Application Insights or application-level telemetry when infrastructure resources appear normal but request latency remains high.
Finally, compare the incident timeline with recent deployments, configuration changes, scheduled jobs, patches, traffic increases, and other operational changes.
What Are the Most Common Windows Server Monitoring Mistakes?
Why Is Monitoring CPU Alone a Problem?
CPU utilization does not identify every performance bottleneck. Storage latency, memory pressure, network dependencies, application processing, and database performance can all affect user experience without producing extreme CPU usage.
Why Should You Avoid Treating Every Performance Spike as an Incident?
Short performance spikes can be normal for specific workloads. Backup operations, scheduled processing, indexing, maintenance, and batch workloads can create predictable resource increases.
Why Is Historical Data Important?
Historical data provides the context required to distinguish normal behavior from abnormal behavior. A current metric becomes more useful when compared against the workload’s previous behavior.
Why Can Too Many Alerts Become a Problem?
Excessive alerts create alert fatigue. When teams receive large numbers of notifications that do not require action, genuinely important incidents can become harder to identify.
Why Should Application Dependencies Be Monitored?
A healthy Windows Server can host an unhealthy application. The application may depend on a slow database, API, authentication service, storage platform, or another downstream system.
Why Should You Avoid Collecting Every Available Metric?
Unfocused telemetry can increase monitoring cost and reduce investigation efficiency. Data collection should serve specific operational and troubleshooting requirements.
What Is the Best Way to Build a Windows Server Monitoring Strategy?
An effective Windows Server monitoring strategy connects infrastructure telemetry with application behavior and operational response. Azure Monitor provides the collection, analysis, visualization, and alerting components required to build that workflow.
The strongest monitoring implementation starts with the workload rather than with a list of available metrics.
Teams should identify the services that matter, define normal operating behavior, collect the telemetry required to diagnose failures, establish useful alerts, and periodically review whether the monitoring configuration still reflects the production environment.
Azure Monitor currently supports monitoring Azure and on-premises services and provides capabilities for metrics, logs, traces, alerts, application monitoring, virtual machines, Log Analytics, dashboards, Workbooks, and related observability scenarios.
How Does Azure Monitor Turn Performance Data into Operational Visibility?
Azure Monitor becomes most valuable when collected telemetry leads to a specific operational decision. Metrics can reveal resource pressure, logs can provide event context, application telemetry can expose request and dependency behavior, and alerts can bring actionable conditions to the attention of the operations team.
Workbooks and dashboards can then present the information needed during routine monitoring or incident response.
Microsoft’s current Azure Monitor documentation describes Workbooks and curated monitoring experiences as visualization options for analyzing collected telemetry and operational health.
The objective is not to create the largest monitoring dashboard.
The objective is to create a monitoring system that helps engineers answer four questions quickly:
What is happening?
When did it start?
What changed?
Where is the actual bottleneck?
How Can ActSupport Help With Windows Server Monitoring?
ActSupport provides server monitoring, infrastructure administration, and technical troubleshooting for businesses that need ongoing operational visibility. Our infrastructure specialists can help analyze Windows Server resource behavior, investigate recurring performance problems, monitor critical workloads, and correlate infrastructure symptoms with application and dependency behavior.
Organizations that operate mixed cloud, virtualized, hosted, or hybrid infrastructure can also benefit from structured monitoring and ongoing infrastructure management rather than relying only on reactive incident handling.
If recurring Windows performance problems are affecting users or business applications, the first step is to establish reliable visibility into the workload and identify the resource or dependency responsible for the degradation.