

What you need to Know:
To fix Apache server high CPU usage, you must tune the MPM modules, reduce KeepAliveTimeout to 3 seconds, and optimize MaxRequestWorkers to prevent process loops. To resolve this, engineers must tune the MaxRequestWorkers directive, optimize KeepAlive settings, and identify bottlenecked PHP-FPM processes or database queries. Implementing proactive Linux server management services ensures that hardware limits align with software demands to maintain 100% uptime.
First, execute the top or htop command to verify if the CPU load stems from the Apache core or underlying CGI/FPM scripts. Second, adjust the MPM Event or MPM Worker settings in the httpd.conf file to prevent process spawning loops. Third, verify that KeepAlive is enabled but restricted to a low timeout (2–3 seconds) to free up worker slots quickly. Finally, deploy real-time server monitoring tools to detect patterns in traffic that suggest a Layer 7 DDoS attack or aggressive bot scraping.
Assessing the Impact of High Load on Production
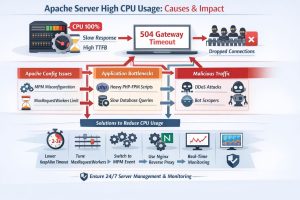
High CPU utilization on an Apache web server is not just a performance issue. It is a critical failure point for enterprise availability. When CPU usage reaches 100%, the kernel scheduler struggles to allocate time to the httpd process. This delay increases the Time to First Byte (TTFB) and impacts user experience.
As CPU pressure grows, the server begins to respond slowly. Eventually, users may face 504 Gateway Timeout errors. At this stage, engineers classify the issue as a Tier-1 incident.
The situation can quickly escalate. The server starts queuing incoming TCP connections. Over time, the connection backlog becomes full. Once this limit is reached, the server begins to drop new requests.
This creates a cascading failure. Without immediate intervention, the server becomes unresponsive and unavailable.
Understanding the Role of MPM Modules in Resource Scaling
The Multi-Processing Module (MPM) dictates how Apache handles incoming requests, and choosing the wrong one is a primary driver of Apache server high CPU usage. The MPM Prefork module, while stable, spawns a new process for every connection, which leads to massive overhead on high-traffic sites. In contrast, MPM Worker and MPM Event use a threaded approach, significantly reducing the CPU context-switching overhead. Transitioning to MPM Event is a cornerstone of modern cPanel server management because it separates the listening thread from the worker thread, allowing the server to handle “Keep-Alive” connections without tying up active CPU resources.
Identifying Bottlenecks with Top and Htop Commands
Diagnosis begins at the command line. Use the top command and press c to see the full command path of the processes consuming resources. If you see dozens of /usr/sbin/httpd processes at the top of the list, the issue resides in the Apache configuration or traffic volume. If you see php-fpm or php-cgi processes, the CPU is being consumed by the application code (e.g., WordPress plugins or heavy Magento scripts). For 24/7 technical support teams, utilizing htop provides a more granular view of per-core utilization, allowing us to see if the load is evenly distributed or if a single thread is “pinning” a core.
Analyzing Apache Access Logs for Traffic Anomalies
We often find that the “root cause” isn’t a configuration error but an external stimulus. Examining /var/log/httpd/access_log or /usr/local/apache/domlogs/ reveals if a specific IP address or User-Agent is hammering the server. Use awk '{print $1}' access_log | sort | uniq -c | sort -nr | head -n 10 to identify the top ten visiting IPs. If a single IP is making thousands of requests per minute to a dynamic URI, it is likely a brute-force attack or a scraper. Integrating server hardening techniques, such as deploying ModSecurity or Fail2Ban, can automatically null-route these IPs at the firewall level before they reach the Apache process.
The Critical Link Between KeepAlive and CPU Saturation
The KeepAlive directive allows multiple requests to be sent over the same TCP connection, which reduces latency for the user. However, if KeepAliveTimeout is set too high (e.g., 15 seconds), Apache worker threads remain occupied doing nothing while waiting for the client. This leads to “worker exhaustion,” where Apache spawns more processes to handle new requests, driving the CPU load higher. Reducing the timeout to 2 or 3 seconds ensures that threads are released back into the pool almost immediately, a standard practice in server security best practices 2026.
Tuning MaxRequestWorkers for High-Concurrency Environments
The MaxRequestWorkers (formerly MaxClients) directive is the most powerful lever for controlling CPU and memory. If this value is too low, requests are queued, and the site feels slow; if it is too high, the server will attempt to process more tasks than the CPU can handle, leading to thrashing. To calculate the ideal value, take the total RAM available to Apache and divide it by the average size of an Apache process. For a server with 8GB RAM where processes take 50MB, a value around 150 is a safe starting point. This prevents the server from spiraling into a high-CPU, high-I/O-wait state.
Dealing with PHP-FPM and Application Layer Overload
In modern stacks, Apache often acts as a proxy for PHP-FPM. If Apache shows high CPU usage, it may be because it is waiting on a slow PHP backend. You must audit the www.conf file in your PHP-FPM configuration. Switching from pm.dynamic to pm.static in high-traffic environments can reduce the CPU spikes caused by the constant spawning and killing of child processes. This level of linux server management services expertise ensures that the handshake between the web server and the application server is seamless and resource-efficient.
Investigating .htaccess Overheads and File System Lookups
Every time a request enters a directory, Apache looks for an .htaccess file. If your directory tree is deep and AllowOverride All is set, Apache performs multiple file system “stat” calls, which consume CPU cycles. Moving these configurations into the main VirtualHost block and setting AllowOverride None eliminates these lookups. This is a subtle but effective server hardening tactic that improves performance by reducing the number of system calls the CPU must execute for every single hit.
Resolving SSL/TLS Handshake Overhead
Encryption is computationally expensive. If your server handles thousands of new HTTPS connections per second, the TLS handshake process can saturate the CPU. Ensure you are using OpenSSL 1.1.1 or higher to take advantage of TLS 1.3, which reduces the number of round trips and the computational load. Implementing OCSP Stapling also offloads the certificate validation work from the client-server relationship to the CA, further shaving off CPU micro-cycles and improving the user experience.
Mitigating ModSecurity and WAF Performance Hits
While ModSecurity is essential for server security, complex Regex rules can cause CPU spikes. If a rule is poorly written, it may cause “backtracking” in the Regex engine, which consumes 100% of a core for a single request. Use the SecRuleEngine DetectionOnly mode temporarily to see if the CPU load drops. If it does, you must identify and optimize the specific rule causing the bottleneck. This is where white label server support experts provide value by auditing WAF logs to balance security with performance.
Using Strace to Debug Deep Process Logic
When standard logs fail, we turn to strace. By attaching to a running Apache process using strace -p [PID], we can see exactly what system calls the process is making. If you see an endless loop of EAGAIN (Resource temporarily unavailable) or futex wait calls, you likely have a thread-locking issue or a kernel-level resource limit being hit. This level of outsourced hosting support services involves deep-diving into the system’s execution layer to find bugs that higher-level monitoring might miss.
Real-World Use Case: The Case of the Blocked Passive Ports
In a recent infrastructure audit for a client using cPanel server management, we encountered a high CPU load that seemed linked to FTP uploads. The CSF firewall was incorrectly configured for Passive FTP. As the server struggled to negotiate ports, the proftpd and httpd processes (handling the web-based file manager) began to hang. By opening the PassivePortRange (e.g., 49152:65534) in both the FTP configuration and the firewall, the CPU load dropped instantly. This demonstrates how network-level blocks can manifest as local CPU exhaustion.
Active vs. Passive FTP: Infrastructure Implications
To prevent the issues mentioned above, engineers must understand the protocol mechanics. In Active Mode, the server initiates the data connection back to the client, which is usually blocked by the client’s firewall. In Passive Mode, the client initiates both connections, which is safer for the client but requires the server to have a range of ports open. Forcing SFTP (SSH File Transfer Protocol) is the preferred enterprise solution, as it operates over a single port (usually 22) and utilizes SSH keys for much higher security and lower protocol overhead.
Hardening Apache Against Brute Force and Layer 7 Attacks
A high CPU is often a symptom of a Brute Force attack on wp-login.php or xmlrpc.php. We recommend implementing a Global Request Limit in Apache. Using mod_ratelimit or mod_evasive, you can set a threshold for how many requests a single IP can make. Additionally, disabling unused modules (like mod_imap, mod_autoindex, and mod_userdir) reduces the attack surface and the memory footprint, ensuring that every CPU cycle spent is dedicated to serving legitimate content.
Transitioning to Nginx as a Reverse Proxy
If Apache’s CPU usage remains high despite tuning, the architectural solution is to deploy Nginx as a reverse proxy. In this setup, Nginx handles all incoming connections and serves static content (images, CSS, JS), while only passing dynamic PHP requests to Apache. Nginx is significantly more efficient at handling thousands of concurrent connections. This “Hybrid” approach is a standard recommendation for cloud infrastructure management services looking to maximize hardware utility.
Monitoring Linux Server Performance for Long-Term Stability
Stability requires more than a one-time fix. We deploy Prometheus and Grafana to track CPU “I/O Wait,” “User,” and “System” time. If “I/O Wait” is high, the CPU is idling while waiting for the disk, meaning you need faster SSDs or database optimization. If “System” time is high, the kernel is overloaded. Continuous server monitoring services 24/7 allow us to catch these trends before they result in a production outage.
Future-Proofing with Server Security Best Practices 2026
As we move into 2026, the complexity of web traffic is increasing due to AI bots and automated scrapers. Server security best practices now include using AI-driven traffic analysis to distinguish between “Good Bots” (like Googlebot) and “Bad Bots” that drain CPU resources. Implementing a “Zero Trust” architecture at the server level ensures that only authenticated and validated traffic interacts with expensive CPU-bound processes.
Stop the Spikes. Restore 100% Uptime.
Is your Apache server still struggling with high CPU load? Don’t let 504 Gateway Timeout errors drive your customers away. Partner with our experts for proactive monitoring and high-availability infrastructure solutions.
Authoritative Conclusion
Resolving Apache server high CPU usage requires a systematic approach that bridges the gap between hardware limitations and software configuration. By transitioning to threaded MPMs, tuning KeepAlive settings, and implementing robust server hardening protocols, you can reclaim your infrastructure’s performance. Partner with 24/7 technical support providers to eliminate downtime. Engineers monitor your production environment’s pulse constantly.
FAQ: Apache Server High CPU Usage
Who should I contact if my Apache server is always at 100% CPU?
You should contact a professional outsourced server management company or a Senior Linux Administrator. They will perform a root cause analysis to determine if the issue is due to traffic spikes, malicious attacks, or misconfigured MPM modules.
What is the fastest way to lower Apache CPU usage?
The fastest way is often to identify and block abusive IP addresses using the firewall and to reduce the KeepAliveTimeout in your Apache configuration to 2 seconds.
Why does Apache use so much CPU on Linux?
It usually happens when the number of concurrent requests exceeds the server’s processing capacity or when a specific script, such as a PHP script, enters an infinite loop or performs heavy database queries.
How do I check Apache logs for errors?
On most Linux systems, you can check the error logs using the command tail -f /var/log/httpd/error_log or tail -f /var/log/apache2/error.log. This provides real-time insight into what is causing the server to struggle.


