

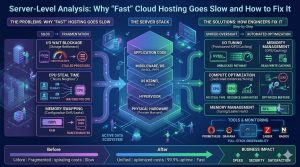
Server-level analysis is the technical process of investigating the root causes of performance degradation within a cloud environment to understand why supposedly high-speed infrastructure is underperforming. This matters because even the most expensive cloud hosting can experience “slowness” due to misconfigured kernels, resource contention, or inefficient application code. By performing deep-dive diagnostics into CPU wait times, I/O bottlenecks, and memory management, engineers solve the mystery of intermittent latency and restore optimal service delivery for end-users.
What is Server-Level Performance Analysis?
In the sophisticated landscape of 2026, server-level analysis has transitioned from a basic health check to a forensic engineering discipline. It involves examining the interaction between the operating system, the hypervisor, and the application stack to identify hidden inefficiencies. While cloud providers promise nearly infinite resources, the way an individual virtual machine (VM) or container utilizes those resources determines the actual user experience. A server might show 10% CPU usage but still feel “slow” because it is waiting on a slow disk or a congested network interface.
This level of analysis goes beyond the dashboard metrics provided by standard cloud consoles. It requires a senior infrastructure engineer to look at the “Wait” states of a processor and the queue depths of a storage volume. Effective analysis abstracts the marketing promises of “Fast Hosting” and focuses on the raw telemetry of the Linux kernel. This approach is essential for DevOps infrastructure management because it ensures that performance issues are caught at the system level before they impact the business’s bottom line.
Why “Fast” Cloud Hosting Goes Slow: The Root Causes
The most common reason high-performance cloud hosting feels slow is resource contention, often referred to as the “Noisy Neighbor” effect. Even in premium environments, multiple virtual servers share the same physical hardware. If one server on a host is performing a massive database backup or is under a DDoS attack, it can saturate the physical bus, causing “Steal Time” on your server. This means your CPU is ready to work, but the hypervisor is making it wait for its turn on the physical processor.
Another frequent root cause is “I/O Wait.” Modern cloud storage, like NVMe-based EBS volumes, is incredibly fast, but it is often throttled by Input/Output Operations Per Second (IOPS) limits. If your application attempts to write more data than your “burst” credits allow, the kernel will put processes into an “uninterruptible sleep” state while waiting for the disk. To the user, this looks like the website is hanging, even though the CPU usage looks perfectly normal on a standard monitor.
Configuration drift also plays a major role in performance decay. Over time, manual updates to PHP settings, MySQL buffers, or Apache modules can lead to a “Memory Leak” where a process consumes more RAM than it releases. Once the server hits its physical memory limit, it begins “Swapping” data to the disk. Since even the fastest SSD is thousands of times slower than RAM, the entire server grinds to a halt. This is why consistent server monitoring and maintenance is non-negotiable for production-grade environments.
How Engineers Diagnose and Fix Slowness Step-by-Step
A senior infrastructure engineer approaches slowness with a “forensic” mindset, starting with the most likely hardware bottlenecks before moving to the software stack. The first step is usually running top or htop to look at the load average. If the load average is significantly higher than the number of CPU cores, the engineer checks the %wa (I/O Wait) and %st (Steal Time) columns. High I/O wait points to a storage bottleneck, while high steal time confirms that the cloud provider’s hardware is oversubscribed.
Once the hardware layer is cleared, the engineer moves to the application environment. They use tools like strace to see what a slow process is doing in real-time or lsof to check for open files and network connections that might be hanging. If a web server is slow, they examine the logs—specifically /var/log/apache2/error_log or /var/log/nginx/error.log—looking for “worker limit reached” or “upstream timed out” messages. These logs often reveal the “Why” behind the “What.”
The fix in a production environment usually involves a combination of resource tuning and architectural changes. If the issue is CPU contention, the engineer might move the workload to a “Compute-Optimized” instance type. If it is a database bottleneck, they might implement “Query Caching” or move the database to a dedicated RDS instance with provisioned IOPS. For software-level leaks, they might implement a process manager like PM2 or set up a cron job to gracefully restart the service during low-traffic periods. This methodical approach is the core of managed cloud support.
Real-World Production Scenarios: CPU Spikes and Latency
Imagine a high-traffic news portal that suddenly slows down during a breaking news event. The initial reaction might be to “Throw more hardware at it,” but a server-level analysis reveals that the CPU is spiking because of a “Regular Expression” (Regex) bottleneck in the web server’s rewrite rules. Adding more servers would only marginally help; the real fix is optimizing the configuration code. This scenario highlights why Linux server management services are about intelligence, not just capacity.
In another scenario, a SaaS company might experience intermittent latency that happens every day at 2:00 AM. While standard monitoring shows the server is “Up,” a deep-dive analysis reveals that a scheduled cron job is hitting the disk so hard that it causes the database to time out. The engineer solves this by “Nicing” the process giving it a lower priority in the kernel scheduler and scheduling it to run across multiple smaller windows instead of one large burst.
Monitoring Tools and the Engineering Stack
To maintain “Fast” hosting, engineers utilize an advanced stack of observability tools. Prometheus and Grafana are the gold standards for visualizing time-series data, allowing engineers to overlay CPU usage with network traffic and disk latency on a single chart. For those requiring 24/7 NOC services, tools like Zabbix or Nagios provide the alerting backbone, sending instant notifications to a support team the moment a “Warning” threshold is crossed.
On the cloud-native side, AWS CloudWatch and Google Cloud Monitoring provide deep insights into the hypervisor layer. However, senior engineers often prefer “Agent-based” monitoring like Datadog or New Relic for application-level visibility. These tools can trace a single user request from the load balancer down to the specific line of code or SQL query that is causing the delay. This “Full-Stack Observability” is what allows for rapid DevOps infrastructure management in complex environments.
Performance, Security, and Cost Impact of Slowness
Performance degradation is not just an inconvenience; it is a security and financial risk. A “slow” server is often more vulnerable to Denial of Service (DoS) attacks because its resources are already stretched thin. An attacker doesn’t need a massive botnet to take down a poorly optimized server; they just need enough traffic to push the already-struggling CPU over the edge. Maintaining a “Performance Buffer” through regular server monitoring and maintenance is a key security best practice.
From a cost perspective, slowness leads to “Over-Provisioning.” Businesses often pay for “Extra Large” instances to mask the symptoms of poor configuration. A server-level analysis can often reveal that a “Medium” instance, correctly tuned, can outperform an unoptimized “Large” instance. By optimizing the server at the kernel and application level, outsourced hosting support teams can often reduce a client’s monthly cloud bill by 30% or more while simultaneously increasing speed.
Best Practices Used by Real Infrastructure Teams
Professional infrastructure teams follow a “Baseline and Compare” strategy. They maintain a record of how the server performs under normal conditions so they can immediately identify anomalies. They also implement “Auto-Scaling” policies that are based on more than just CPU usage. A smart auto-scaling group might trigger based on “Request Latency” or “Memory Pressure,” ensuring that new servers are added before the existing ones become “Slow.”
Another best practice is “Statelessness.” Engineers ensure that no critical data resides on the web server’s local disk, allowing them to terminate and replace a slow server instantly without data loss. This approach lets engineers replace problematic instances immediately to restore service, while moving the original instance to a quarantine environment for deep forensic analysis.
Case Study: Reclaiming Speed for a Global E-commerce Site
An e-commerce client was using a premium “Compute-Optimized” cloud plan but was seeing checkout page load times of over 5 seconds. Their previous host suggested upgrading to an even more expensive plan. When our Linux server management services team took over, we performed a server-level analysis and discovered that the issue wasn’t CPU power. Instead, the server was suffering from “PHP-FPM Process Exhaustion.”
The server was configured to handle 50 concurrent connections, but during peak hours, it was receiving 200. The extra 150 users were being put into a queue, creating the 5-second delay. We didn’t add more hardware; we tuned the PHP-FPM pool settings and implemented an Nginx “Micro-cache” for non-logged-in users. Load times dropped to under 800ms, and the client actually downgraded their server plan, saving $400 a month while gaining a significantly faster site.
Quick Summary
Server-level analysis is the deep-dive investigation of a server’s performance to find why it is slow despite having “fast” hardware. It solves the problem of “invisible” bottlenecks like I/O wait, CPU steal time, and memory swapping. Engineers fix these issues by using tools like htop, Prometheus, and Zabbix to find the root cause, then tuning the kernel and application configurations. This ensures high uptime, lower cloud costs, and a better experience for users.
Struggling with Traffic Spikes and Downtime?
Partner with our experts for reliable cloud auto-scaling, proactive monitoring, and high-availability infrastructure solutions.
FAQ: Cloud Server Performance and Troubleshooting
Why is my cloud server slow when CPU usage is low?
Your server might be waiting on other resources. Check for “I/O Wait” (waiting for the disk) or “Network Latency” (waiting for data from another server). Low CPU usage often indicates that the server is stalled rather than actively processing tasks.
What is CPU Steal Time and why does it matter?
CPU steal time occurs when the cloud provider shares physical hardware with multiple users. Your server requests CPU resources, but another workload consumes them. This “noisy neighbor” effect reduces performance even on high-spec servers.
How do engineers diagnose a memory leak?
Engineers monitor memory usage using tools like free -m and ps. If memory usage continues to increase and does not drop after traffic decreases, a process is likely leaking memory and requires debugging or restarting.
Can fast hosting still be slow for SEO?
Yes. Google evaluates Core Web Vitals, especially Time to First Byte (TTFB). Poor server management increases response time, which negatively affects SEO rankings even if the website code is optimized.
Is it better to upgrade hardware or optimize code?
Engineers prioritize optimization before upgrading hardware. A poorly configured server wastes resources, while optimized code and infrastructure deliver better performance without unnecessary cost.
Conclusion: Performance is a Management Choice
In 2026, the difference between a slow “Fast” server and a truly high-performance environment is expert management. You cannot simply buy your way to speed with expensive cloud plans; you must engineer it. Companies unlock infrastructure potential through methodical server-level analysis. Proactive 24/7 NOC services and deep technical expertise support this process
Related Posts
May 28, 2026
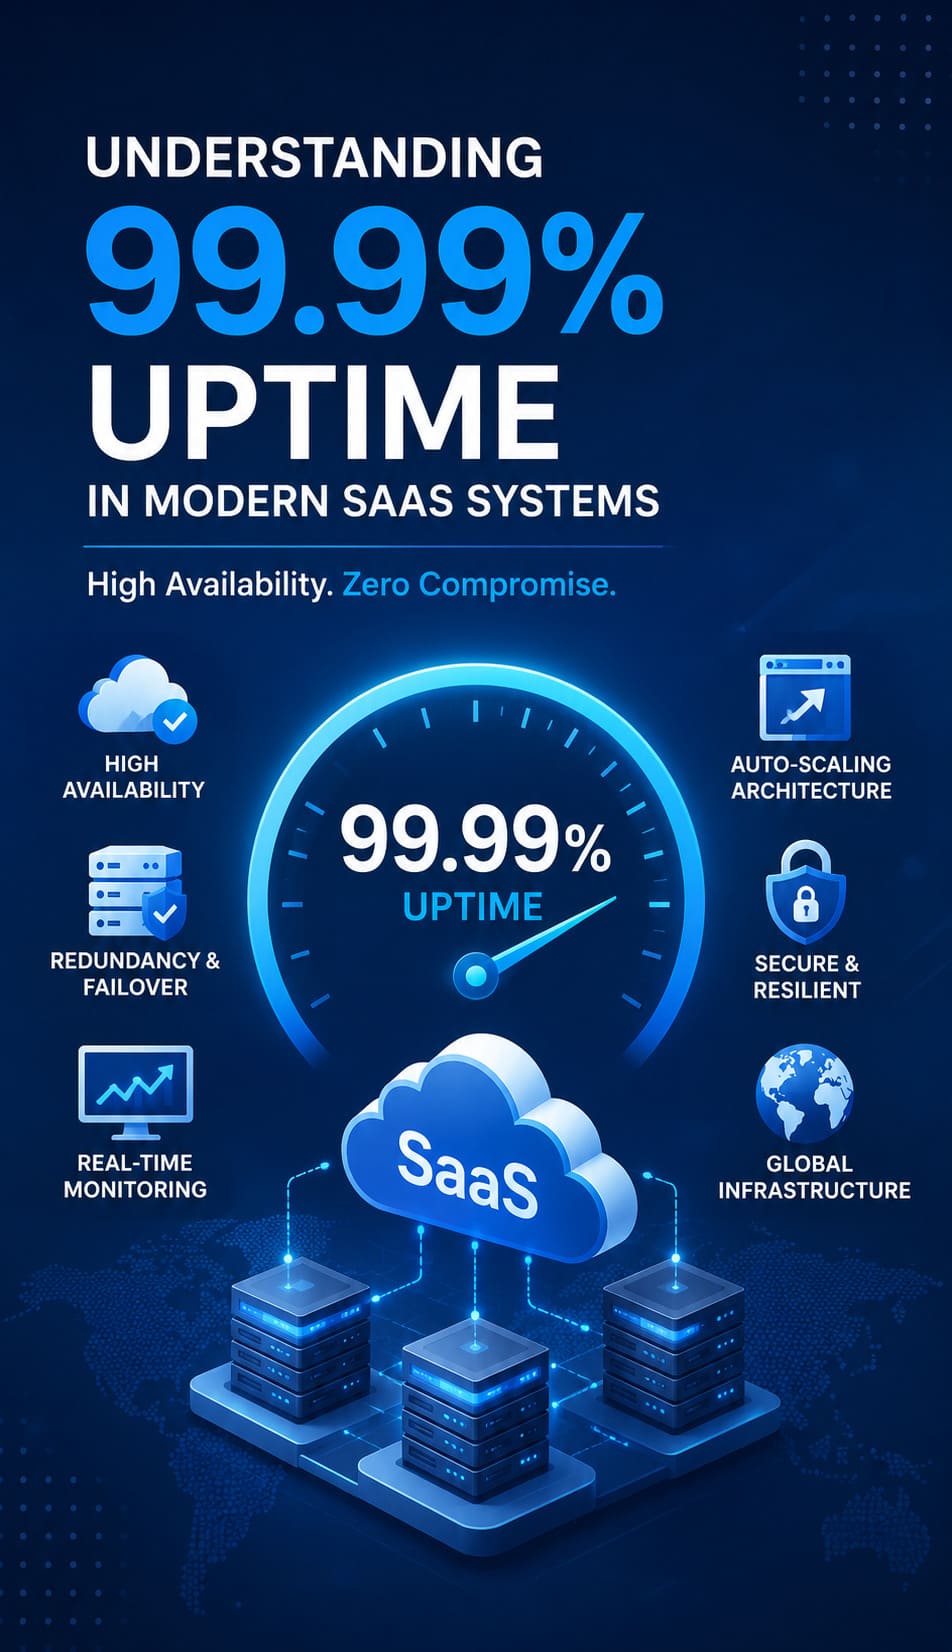
Understanding 99.99% Uptime in Modern SaaS Systems
Business-Critical Importance of High Availability In modern SaaS ecosystems, uptime is not just a technical…
May 27, 2026
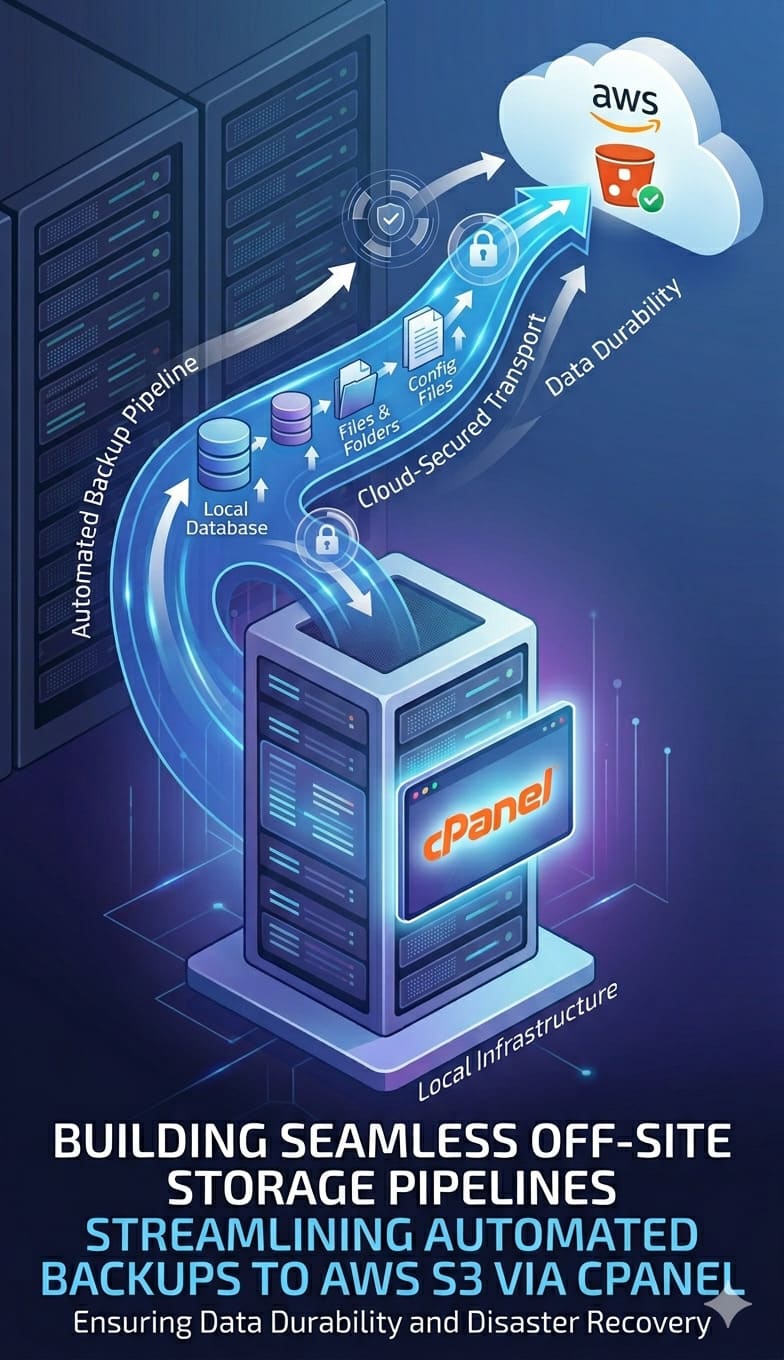
Building Seamless Off-Site Storage Pipelines: Streamlining Automated Backups to AWS S3 via cPanel
Why Modern Hosting Infrastructure Requires Off-Site Backup Pipelines Modern hosting infrastructure is constantly exposed to…
May 18, 2026
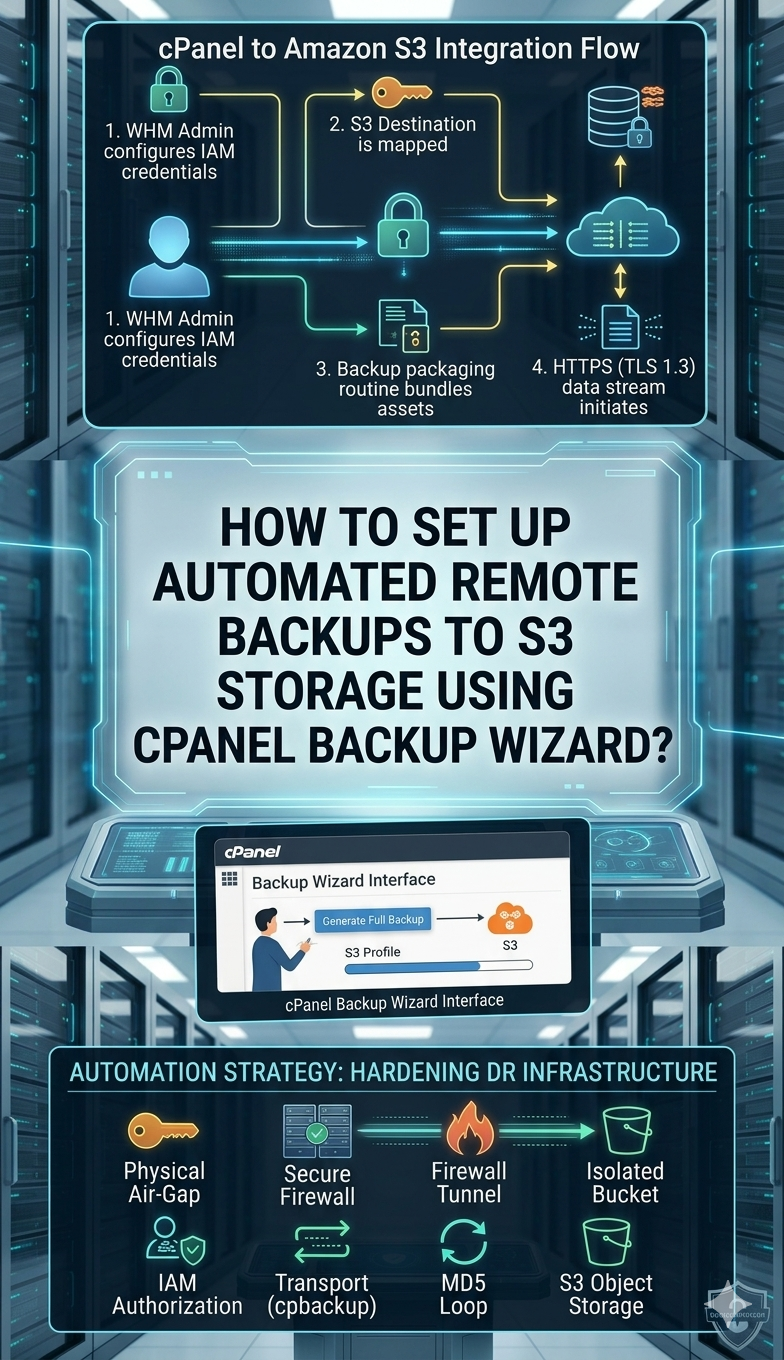
How to Set Up Automated Remote Backups to S3 Storage Using cPanel Backup Wizard
Summary Setting up automated off-site data pipelines is critical for safeguarding hosting environments against hardware…

April 28, 2026
Your VPN Is the Unlocked Back Door Hackers Are Walking Through Right Now
Overview For a long time, VPNs were treated like the gold standard of remote access.…

April 20, 2026
AI Pentesting for Business: How to Catch Security Gaps Before Hackers Use AI?
Key Takeaways: AI pentesting for business uses autonomous, agentic models to simulate real-world cyberattacks and…
April 20, 2026
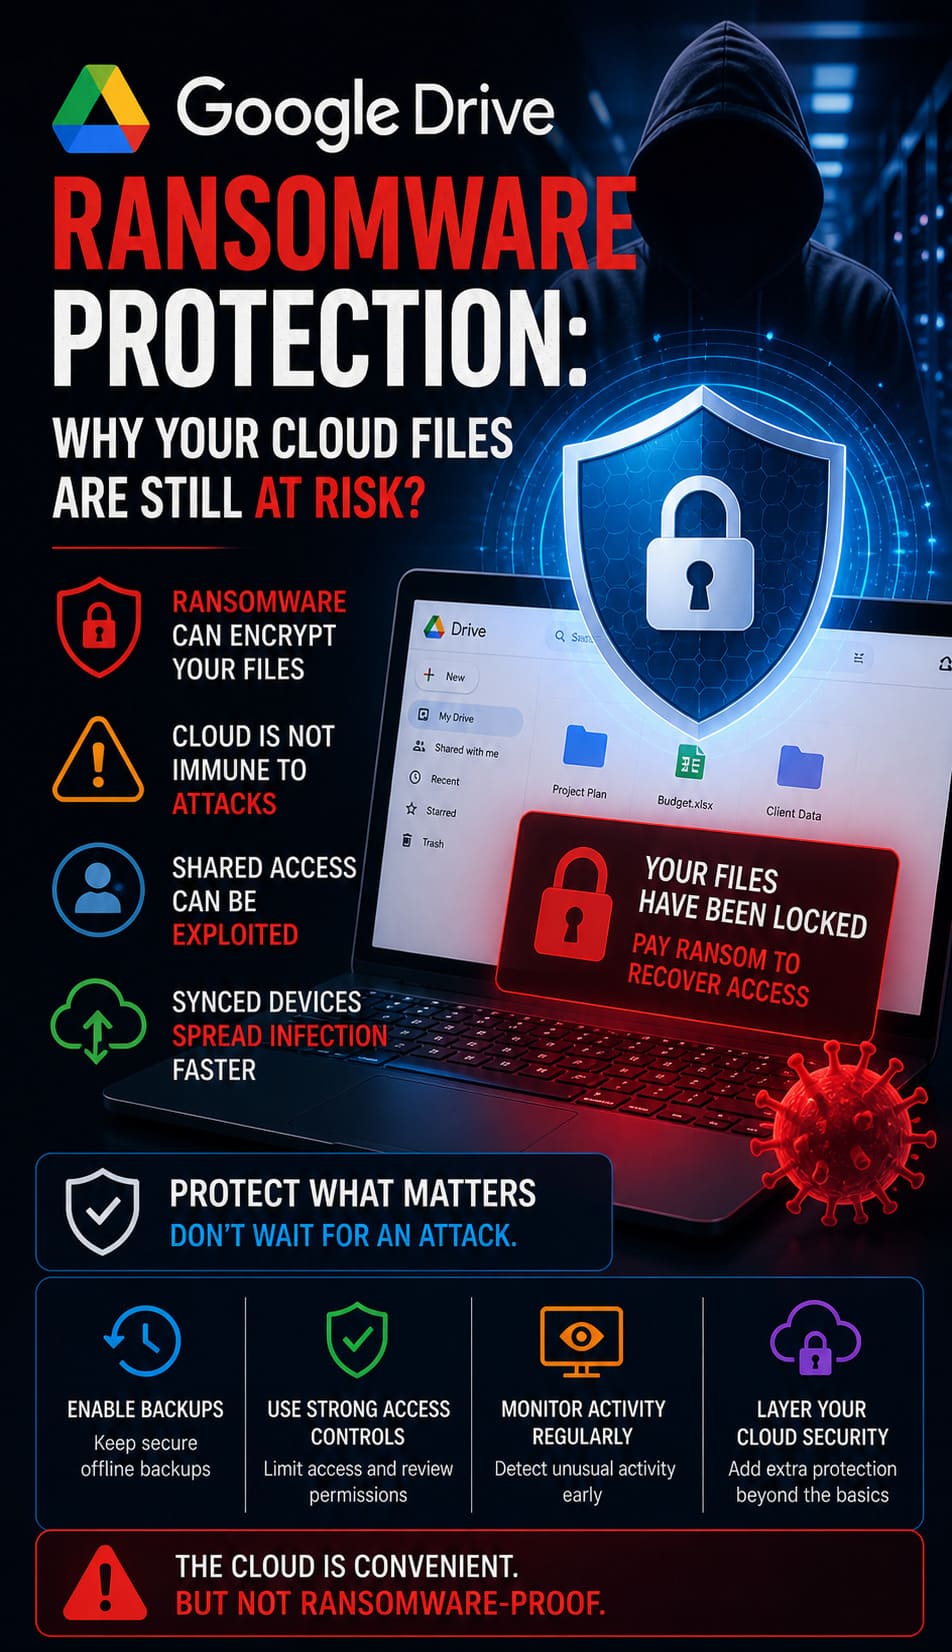
Google Drive Ransomware Protection: Why Your Cloud Files are Still at Risk?
Quick Breakdown: Google Drive Ransomware Protection Analysis Google Drive is vulnerable to automated ransomware because…
April 17, 2026
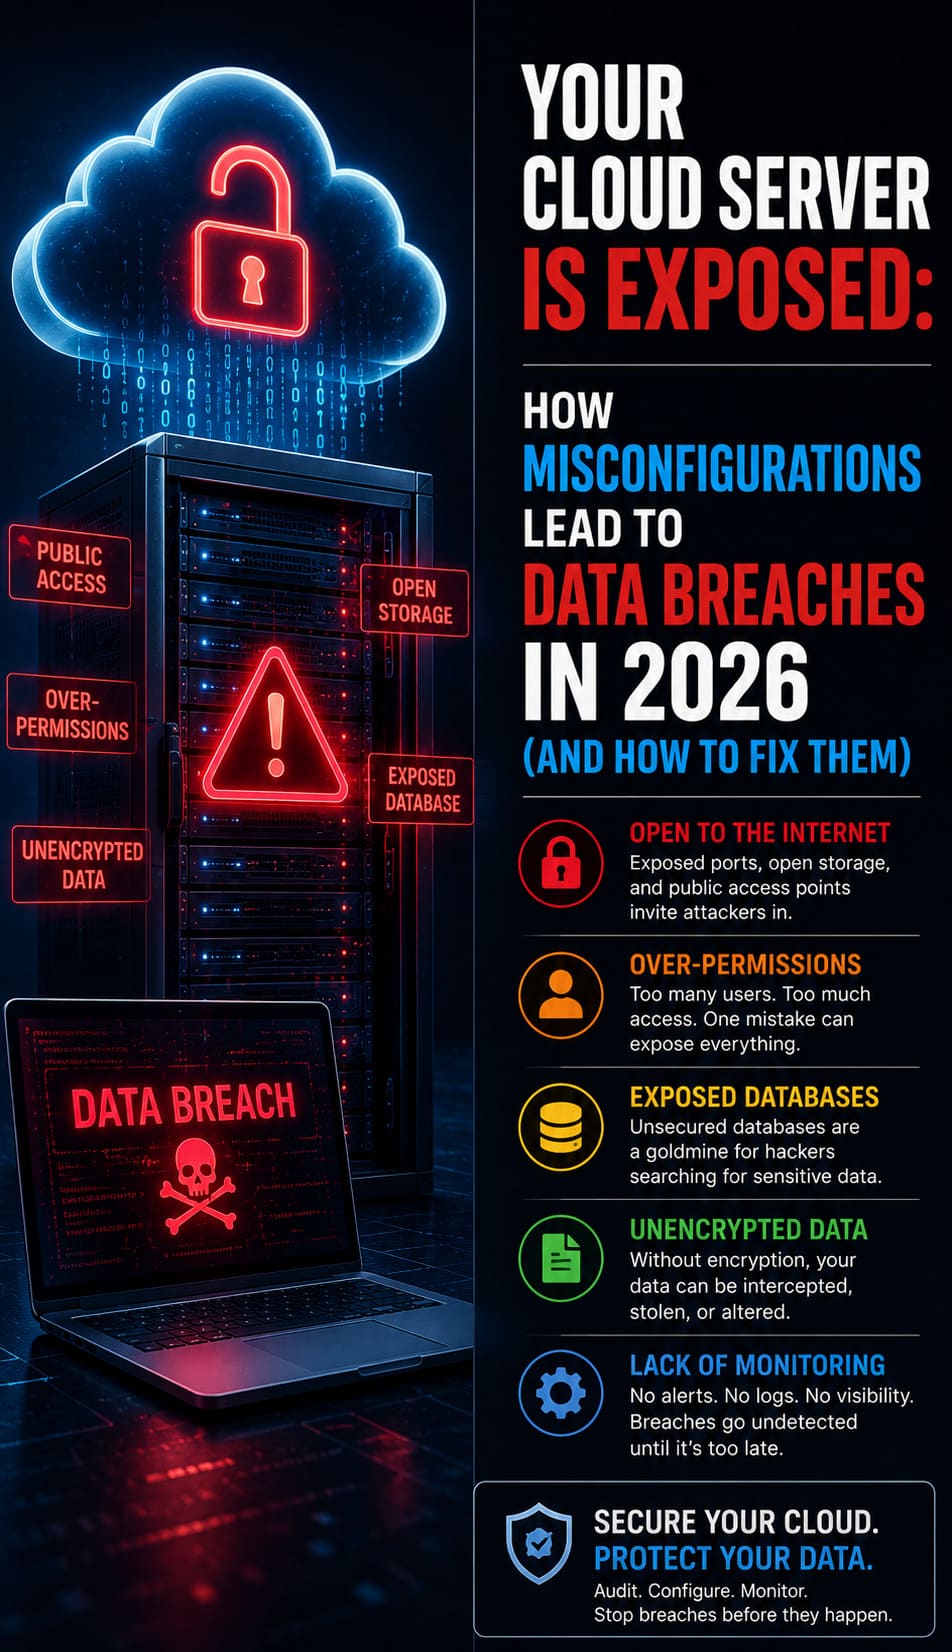
Your Cloud Server Is Exposed: How Misconfigurations Lead to Data Breaches in 2026 (And How to Fix Them)
Summary: Critical Infrastructure Protection Takeaways To optimize for Google’s 2026 AI Overviews and Featured Snippets,…


