

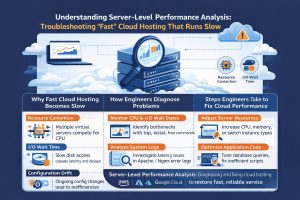
24/7 monitoring and maintenance is a comprehensive infrastructure strategy that combines real-time telemetry, automated alerting, and human expertise to ensure the continuous health of digital assets. While basic tools only check if a site is “up,” a true monitoring blueprint tracks internal system metrics to identify “grey failures” before they cause an outage. This approach matters because it allows businesses to maintain high availability and performance by proactively addressing resource exhaustion and security anomalies before they impact the end-user experience. Server-level performance analysis provides deep visibility into system behavior, helping engineers detect hidden performance bottlenecks
Understanding the Modern Monitoring Blueprint
A professional monitoring blueprint is the architectural foundation of a resilient digital presence. It moves the focus from binary “Up/Down” statuses to deep-stack observability. In an era where microservices and distributed clouds are the norm, simply knowing that a server responds to a ping is insufficient. Engineers must understand how every component from the load balancer to the database query execution time is behaving in real-time. This comprehensive visibility is what allows modern enterprises to achieve the coveted five-nines (99.999%) of uptime.
This concept integrates multiple layers of data, including metrics, logs, and traces. By establishing a “Single Pane of Glass” view, infrastructure teams can see the correlation between a spike in web traffic and a rise in database memory usage. This structural approach is essential for cloud infrastructure management services as it transforms reactive firefighting into proactive health management. It creates a predictable environment where scaling decisions are based on data rather than guesswork.
Why Basic Uptime Robots Fail: The Root Causes of the Visibility Gap
The “Uptime Robot” approach often fails because it only monitors the exterior “doorway” of an application. A server can return a successful status code while its internal processes are slowly dying. For instance, a memory leak might be consuming 98% of available RAM, causing the application to respond slowly but still technically remain “up.” Basic monitors miss these internal warning signs, leading to a “Black Swan” event where the server suddenly crashes without prior external warning.
Furthermore, basic monitoring lacks context regarding “Grey Failures.” These are scenarios where a service is partially functional but degraded. An undersea cable issue might cause a 500ms latency spike between your frontend and your database. A standard uptime check will see the site is “online,” but your customers will experience a site that feels broken. Without deep-level server monitoring and maintenance, these performance degradations go unnoticed until they have already resulted in lost revenue and customer frustration.
Technical debt also contributes to these failures. As systems grow, engineers often add new services without updating the monitoring stack. This results in “monitoring silos” where the network team sees one set of data and the application team sees another. When an issue occurs, the lack of a unified blueprint leads to the “blame game,” where each team claims their specific silo is healthy while the overall user experience remains poor.
How Senior Engineers Build the Blueprint Step-by-Step
Building a production-grade blueprint begins with the implementation of an “Agent-Based” strategy. Unlike external “pings,” agents are small software packages installed directly on the OS. These agents allow engineers to monitor internal kernel metrics such as I/O wait times and CPU steal time. By using tools like Zabbix or Nagios, teams can set granular thresholds that trigger alerts long before a critical failure occurs. For example, an alert can be sent if disk space hits 80%, providing days of lead time to clear logs or expand volumes.
The second step involves centralizing telemetry using a time-series database like Prometheus. This allows for the storage of historical data, which is vital for “Trend Analysis.” An engineer can look back over thirty days to see if memory usage is slowly creeping upward, which is a definitive sign of a memory leak. Once the data is centralized, Grafana is used to create dashboards that visualize these trends. This visual layer allows 24/7 NOC services to spot anomalies at a glance, such as a sudden change in traffic patterns that might indicate a bot attack or a misconfigured deployment.
Finally, the blueprint is integrated into the incident response workflow. This means that an alert doesn’t just send an email; it triggers a specific set of automated actions. If a web server’s CPU spikes, the system can automatically trigger a “Scale-Out” event to add more capacity. If a service stops responding, the system can attempt an “Auto-Healing” restart of the daemon. This level of automation, supported by managed cloud support, ensures that the infrastructure can protect itself even in the middle of the night.
Real-World Production Scenarios: From Spikes to Failures
In a high-stakes production environment, the monitoring blueprint is tested by sudden volatility. Imagine a retail site during a flash sale. Traffic jumps by 400% in minutes. A basic monitor would see the site is up, but a senior engineer’s dashboard would show that the database “Connection Pool” is nearly saturated. By identifying this “Saturation” signal early, the NOC team can manually scale the database or implement “Connection Throttling” to prevent a total database lockup that would crash the entire site.
Another common scenario involves “Silent Database Failures.” A secondary database node might fail its heartbeat check. In a resilient blueprint, the monitoring system detects this immediately and updates the load balancer to stop sending traffic to that node. Simultaneously, it alerts the Linux server management services team to investigate the root cause. Because the monitoring blueprint was in place, the end-users never saw an error page; the system successfully routed around the failure while the engineers worked behind the scenes.
Tools, Monitoring Systems, and the Engineering Approach
The modern engineering stack relies on a hierarchy of tools. At the infrastructure layer, Prometheus handles metrics collection from Linux nodes and Kubernetes clusters. It excels at scraping numerical data and evaluating complex alert rules. For deep-dive log analysis, the ELK Stack (Elasticsearch, Logstash, Kibana) is used to parse millions of log lines to find the “needle in the haystack” such as a specific database error that only occurs once every thousand requests.
When managing cloud-native environments, engineers integrate AWS CloudWatch or Azure Monitor into their central hub. These tools provide “Hypervisor-Level” data that agents cannot see, such as the underlying physical hardware health. Engineers actively monitor the ‘Four Golden Signals’: latency, traffic, errors, and saturation to maintain a complete view of system health and avoid alert fatigue.
Performance, Security, and Cost Impact of Deep Monitoring
The impact of a 24/7 monitoring blueprint on business operations is significant. From a performance perspective, it allows for “Right-Sizing.” By analyzing historical resource usage, outsourced hosting support providers can identify servers that are over-provisioned. If a server never uses more than 20% of its CPU, it can be moved to a smaller, cheaper instance. This data-driven approach often leads to substantial savings on the monthly cloud bill while actually improving performance through better resource allocation.
Security is also bolstered by deep monitoring. Many cyberattacks, such as data exfiltration or crypto-jacking, manifest as subtle changes in system behavior. A sudden increase in outbound network traffic or an unusual CPU spike in a background process can be the first sign of a breach. A robust monitoring blueprint includes “Anomaly Detection” that alerts the DevOps infrastructure management team to these irregularities, allowing for a rapid response that can contain a threat before data is compromised.
Best Practices Used by Real Infrastructure Teams
Top-tier infrastructure teams follow the “Monitoring as Code” (MaC) philosophy. This means that whenever a new server is deployed via Terraform, the monitoring rules and dashboards for that server are created automatically. This ensures that no part of the infrastructure is ever “Dark” or unmonitored. It also prevents human error, as the monitoring configuration is version-controlled and tested just like the application code itself.
Another best practice is “Actionable Alerting.” Teams avoid “Noise” by only sending alerts for issues that require human intervention. If a system can fix itself (e.g., auto-scaling), no alert is sent unless the auto-scaling fails. This keeps the 24/7 NOC services focused on critical issues, preventing “Alert Fatigue” where engineers begin to ignore notifications because they are usually false alarms. This discipline is what separates professional server management from amateur setups.
Case Study: Saving a FinTech Platform from a “Hidden” Leak
A FinTech startup was experiencing mysterious crashes every Friday afternoon. Their basic uptime checks showed 100% availability until the moment the site died. Our managed cloud support team implemented a 24/7 monitoring blueprint and quickly identified the culprit: a memory leak in a reporting service that ran once a week.
The RAM usage was growing by 2% every hour. Because the uptime robot only checked the “Login Page,” it never saw the backend services gasping for air. We set a Zabbix alert for “Memory Growth Velocity” and identified the specific Python function causing the leak. We fixed the code and implemented a “Service Watchdog” that would gracefully restart the process if it ever crossed a safety threshold again. The Friday crashes stopped immediately, and the client avoided a planned $2,000 hardware upgrade.
Quick Summary:
A 24/7 monitoring blueprint is an advanced infrastructure strategy that tracks internal system health (CPU, RAM, I/O) rather than just external uptime. It solves the problem of “grey failures” and silent crashes by using tools like Prometheus, Zabbix, and Grafana to provide real-time visibility. By implementing this blueprint, engineers can proactively fix bottlenecks, automate scaling, and ensure 99.9% availability. This approach is the industry standard for managed cloud support in 2026.
Struggling with Traffic Spikes and Downtime?
Partner with our experts for reliable cloud auto-scaling, proactive monitoring, and high-availability infrastructure solutions.
Conclusion: Future-Proofing Through Observability
The complexity crisis of 2026 demands more than just basic survival; it demands peak performance. Moving beyond the “Uptime Robot” and adopting a comprehensive 24/7 monitoring blueprint is the only way to ensure your business remains competitive in a digital-first economy. By combining automated telemetry with professional outsourced hosting support, you transform your infrastructure from a liability into a high-performance asset.
Related Posts
May 28, 2026
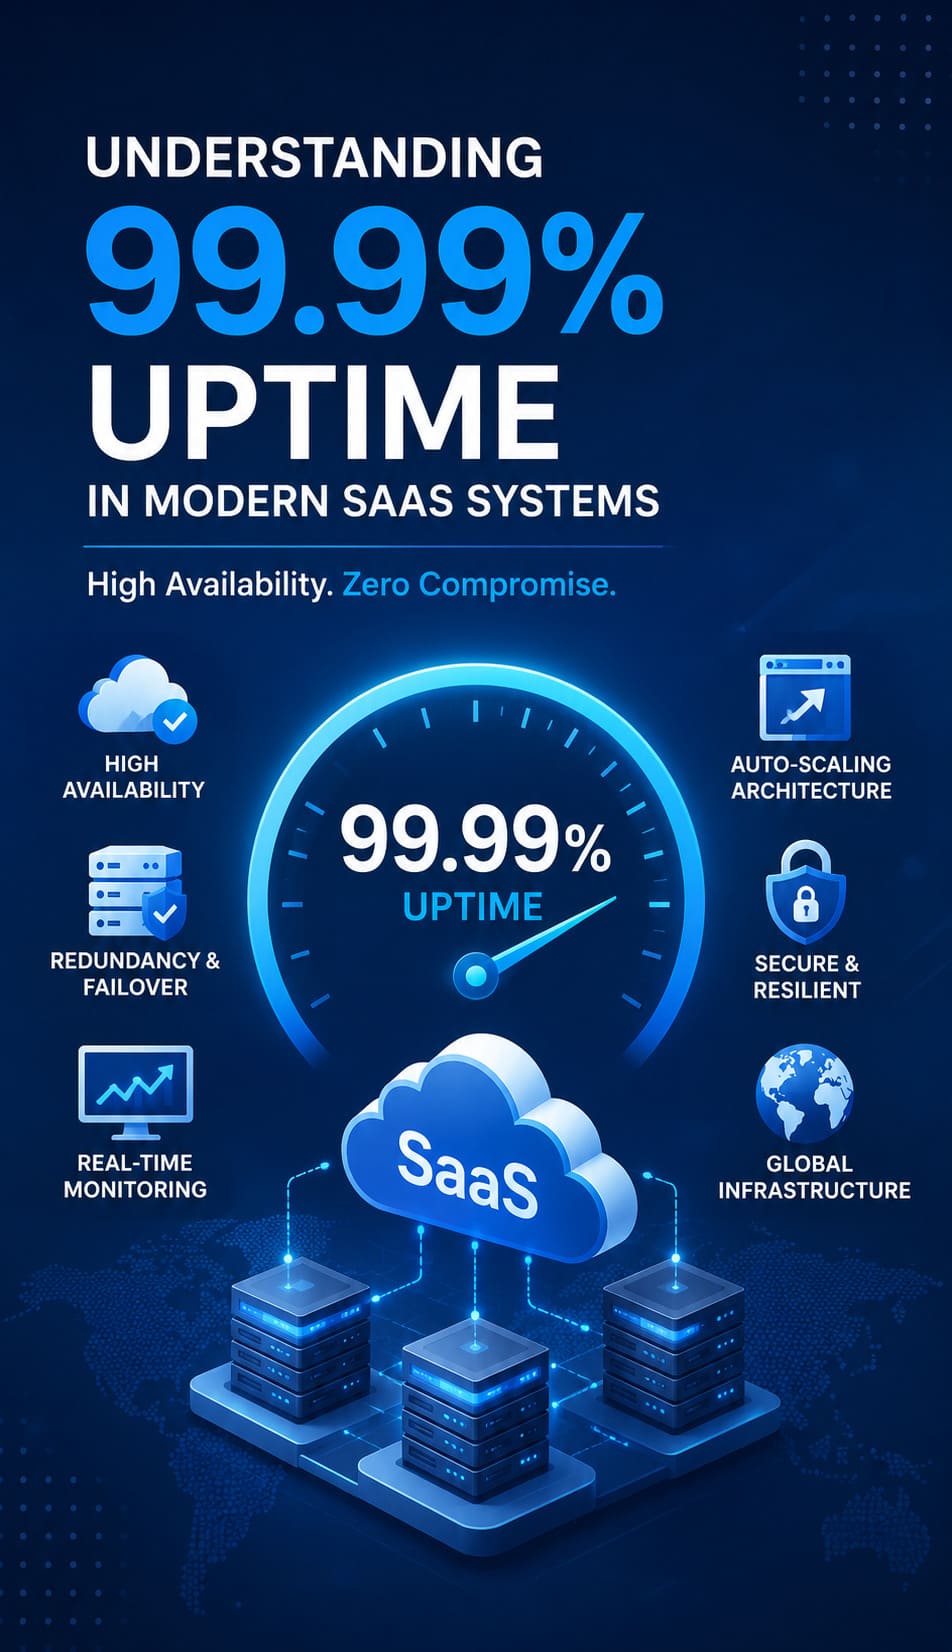
Understanding 99.99% Uptime in Modern SaaS Systems
Business-Critical Importance of High Availability In modern SaaS ecosystems, uptime is not just a technical…
May 27, 2026
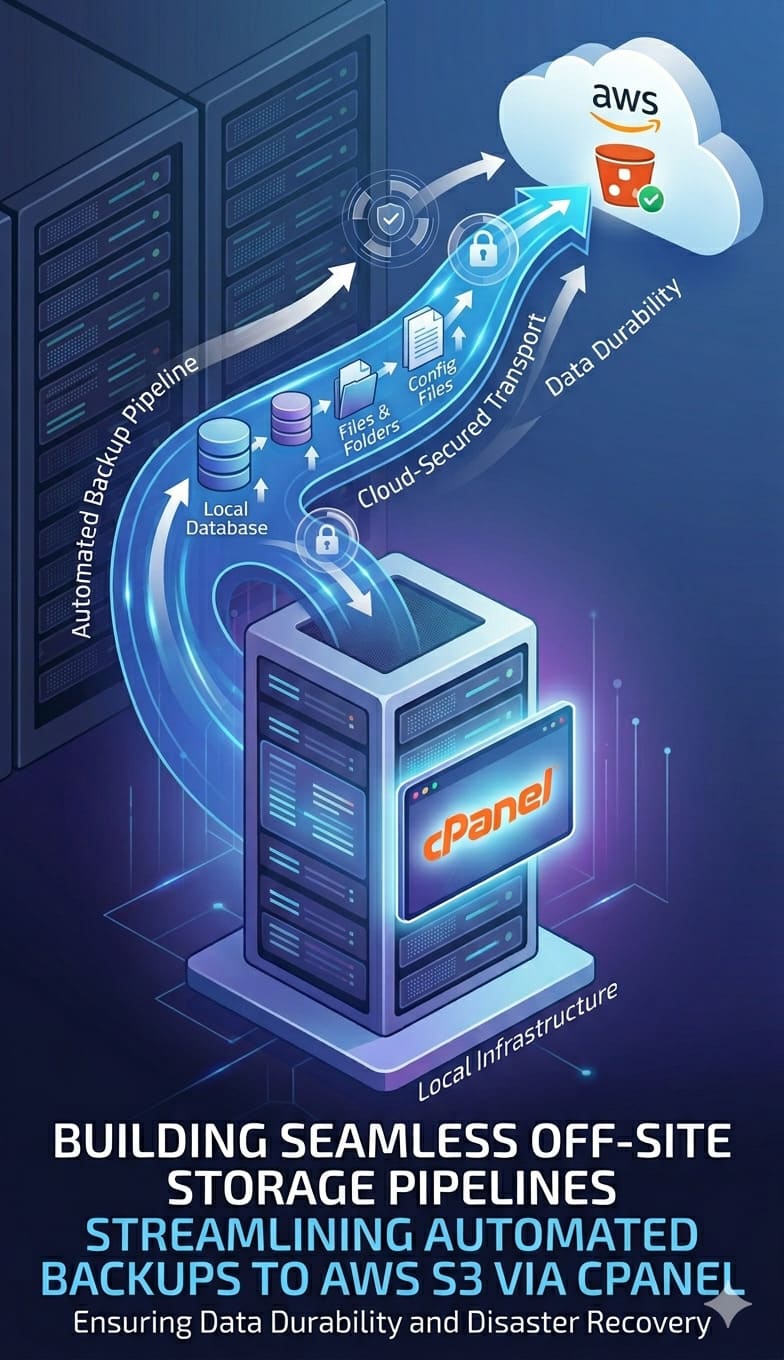
Building Seamless Off-Site Storage Pipelines: Streamlining Automated Backups to AWS S3 via cPanel
Why Modern Hosting Infrastructure Requires Off-Site Backup Pipelines Modern hosting infrastructure is constantly exposed to…
May 18, 2026
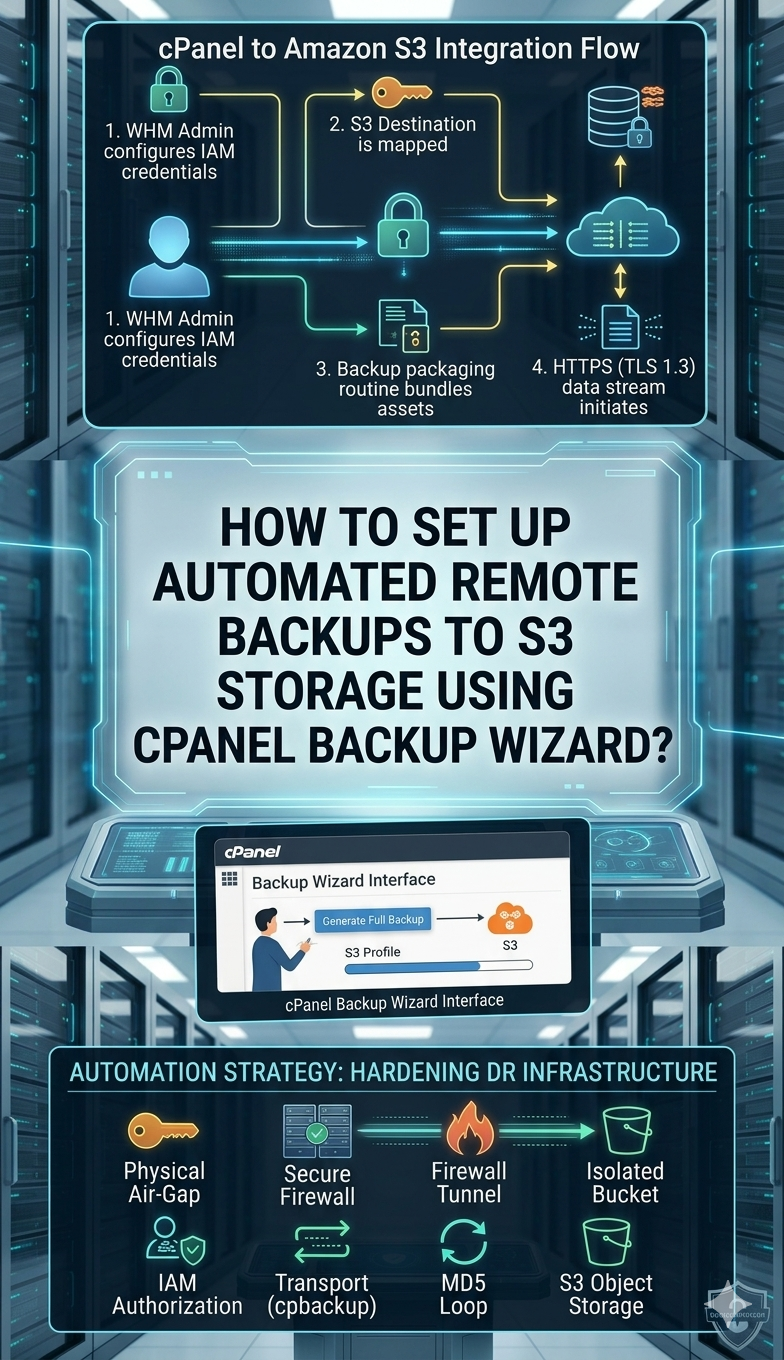
How to Set Up Automated Remote Backups to S3 Storage Using cPanel Backup Wizard
Summary Setting up automated off-site data pipelines is critical for safeguarding hosting environments against hardware…
May 7, 2026
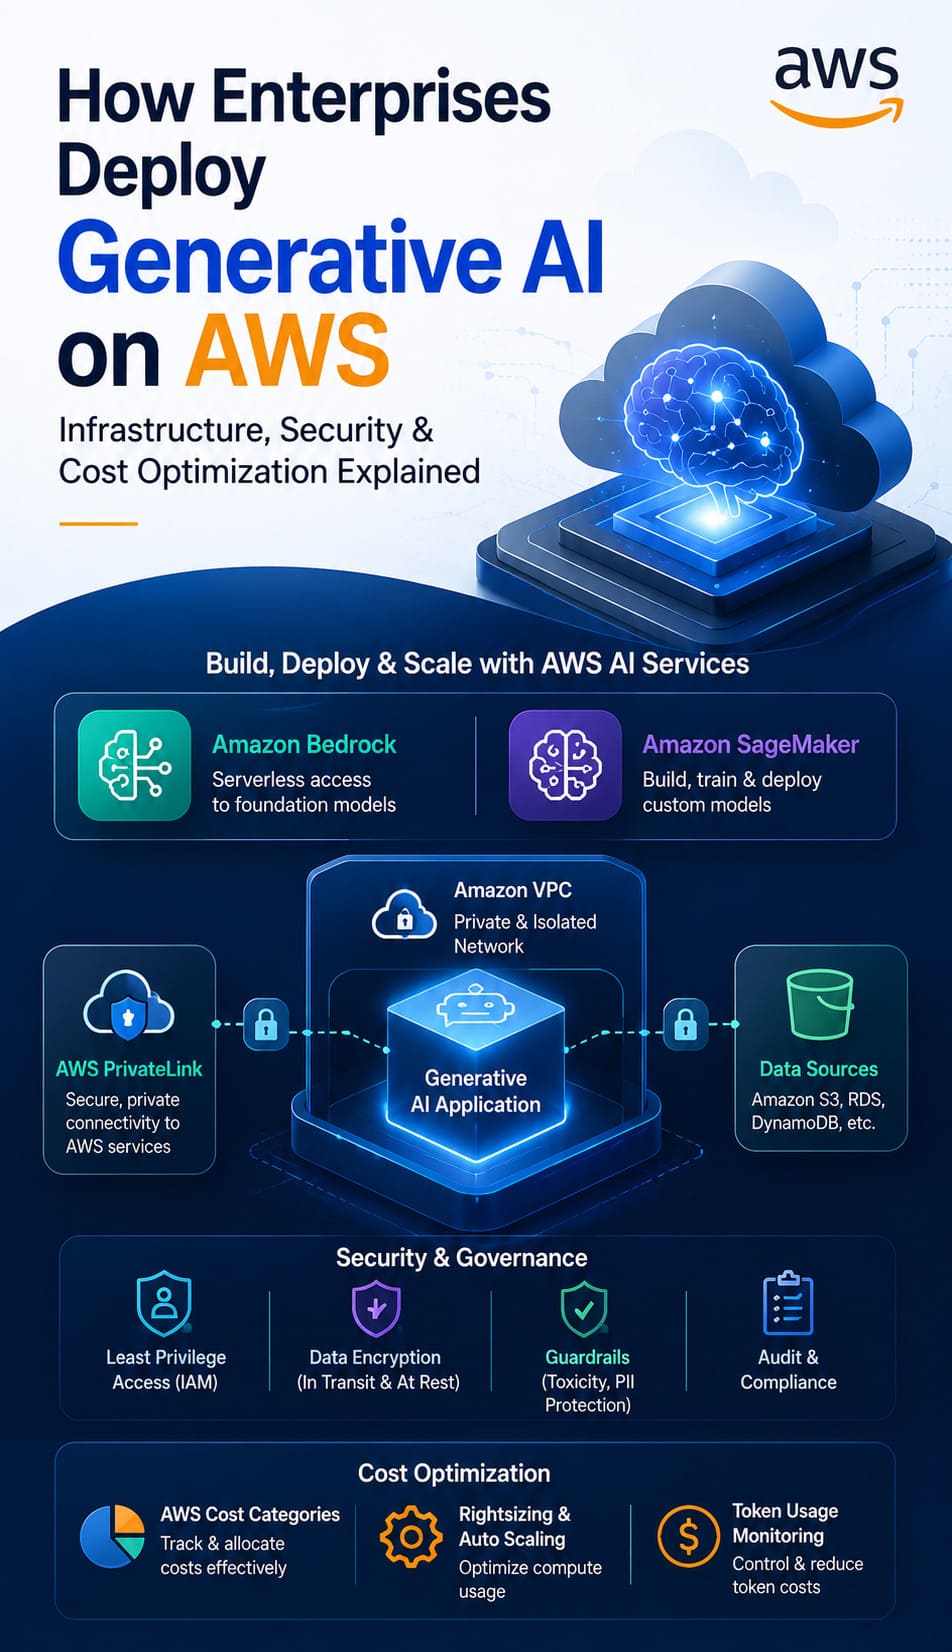
How Enterprises Deploy Generative AI on AWS: Infrastructure, Security & Cost Optimization Explained
Generative AI Overload + Skyrocketing AWS Bills + Data Leak Risks: The Enterprise Blueprint for…

April 28, 2026
Your VPN Is the Unlocked Back Door Hackers Are Walking Through Right Now
Overview For a long time, VPNs were treated like the gold standard of remote access.…
April 20, 2026
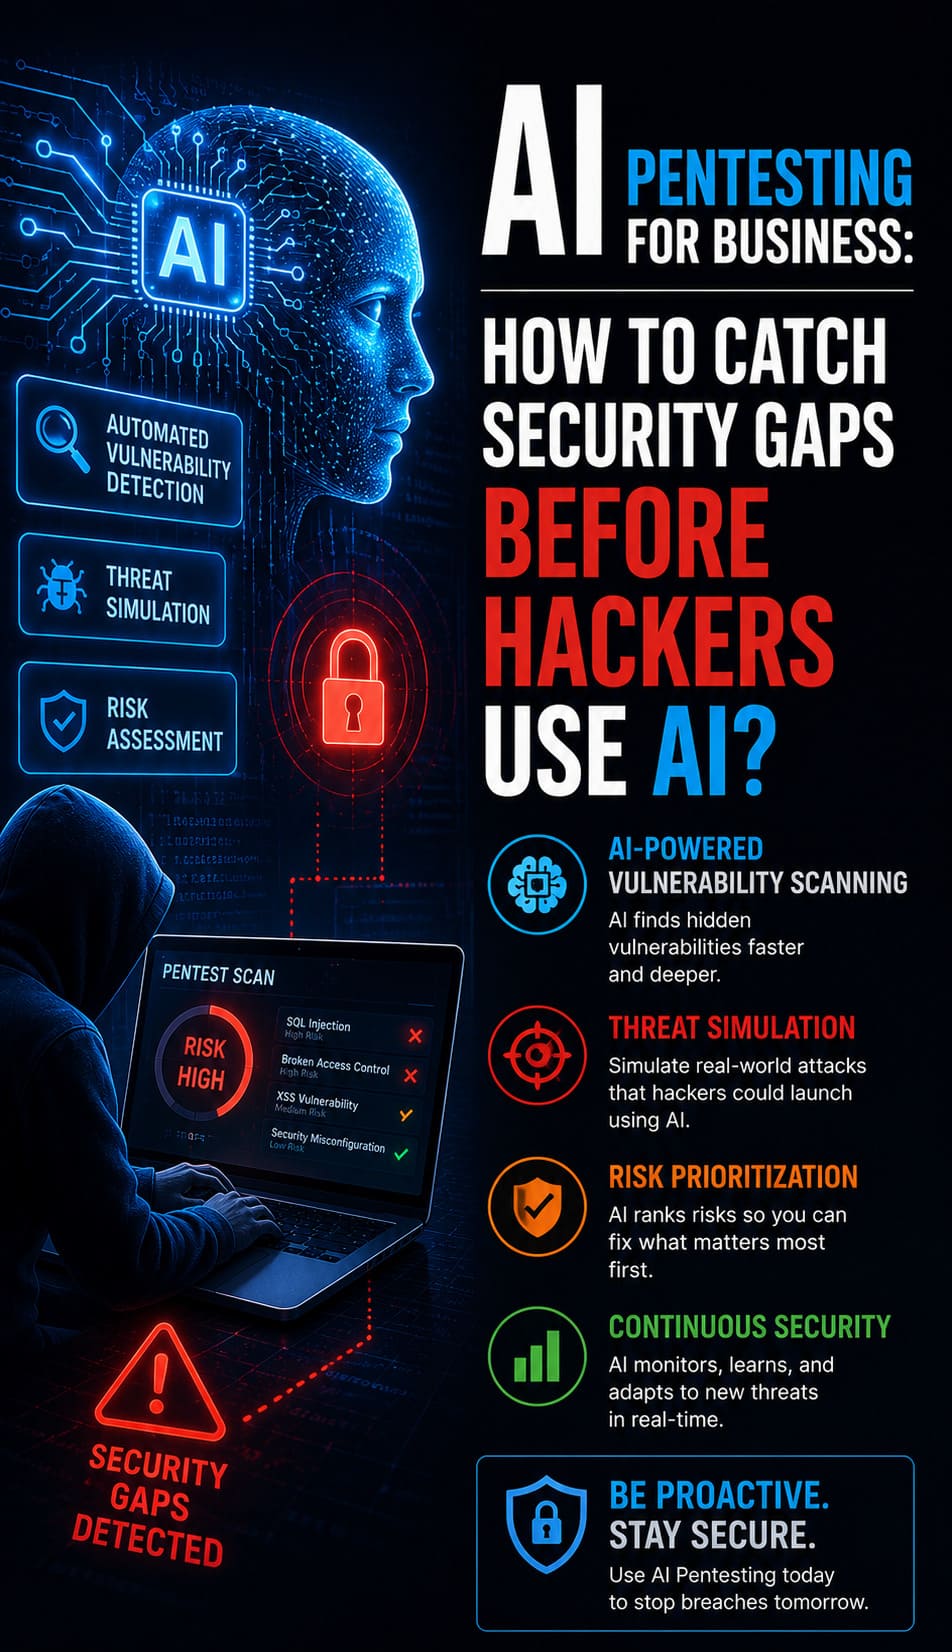
AI Pentesting for Business: How to Catch Security Gaps Before Hackers Use AI?
Key Takeaways: AI pentesting for business uses autonomous, agentic models to simulate real-world cyberattacks and…
April 20, 2026
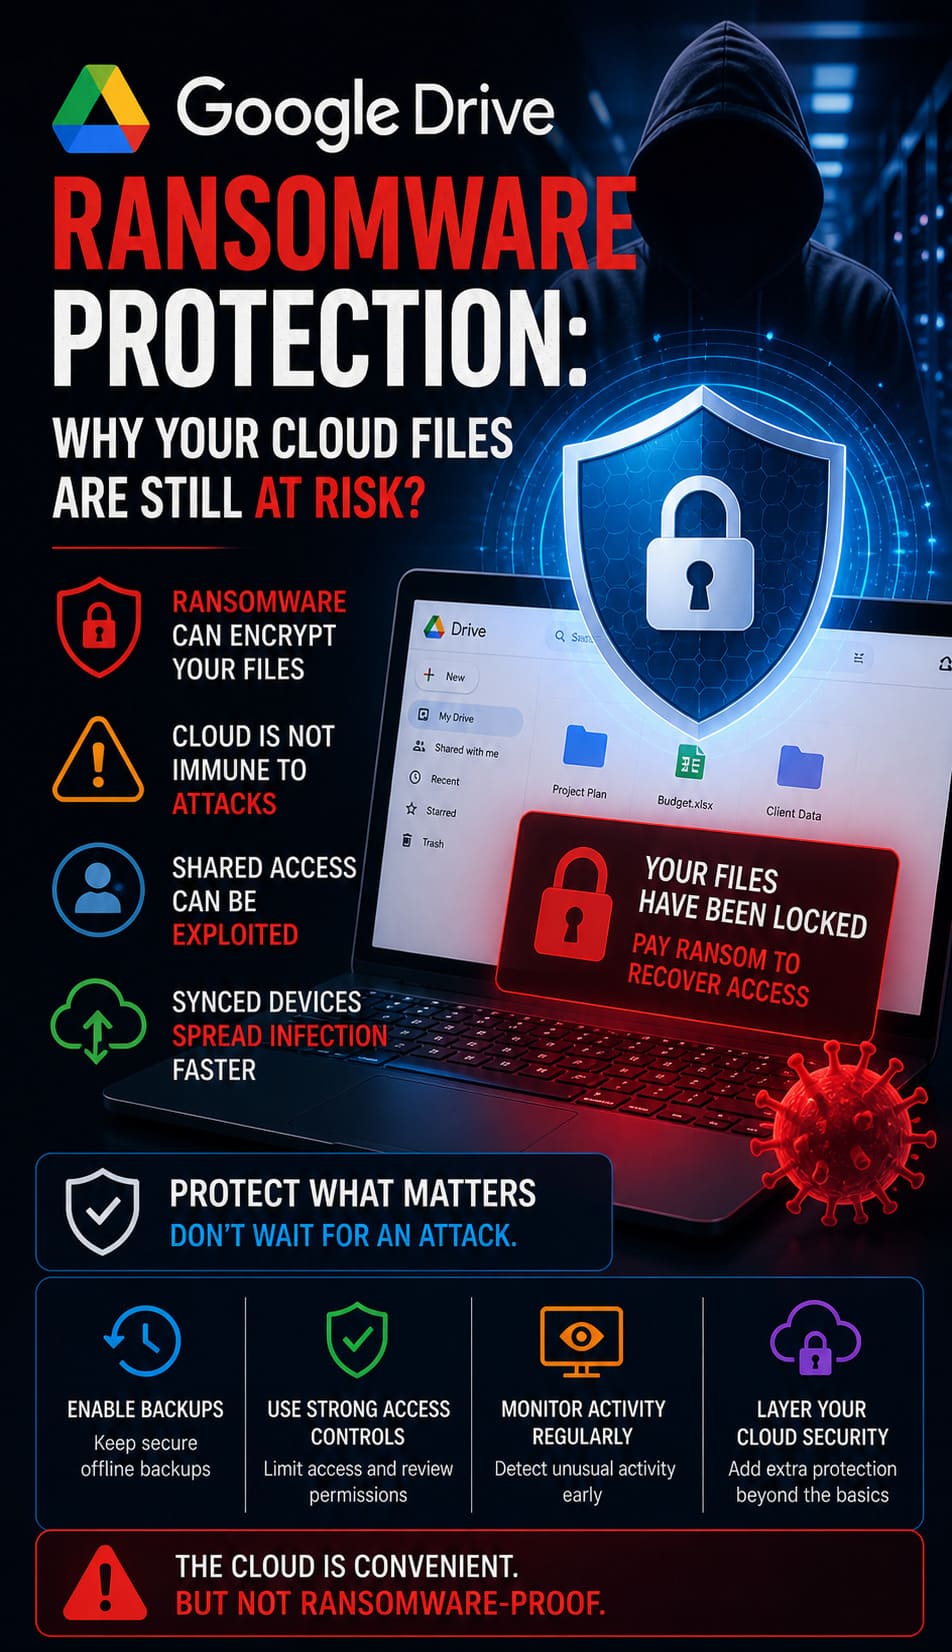
Google Drive Ransomware Protection: Why Your Cloud Files are Still at Risk?
Quick Breakdown: Google Drive Ransomware Protection Analysis Google Drive is vulnerable to automated ransomware because…


