
INTRODUCTION
Production incidents still occur after DevOps automation because automation does not eliminate distributed system complexity. It only accelerates failure propagation. Most incidents originate from timing gaps, state drift, and hidden resource contention across production infrastructure layers.
DevOps automation improves delivery speed but does not guarantee production stability. Real-world traffic exposes architectural gaps that CI/CD pipelines never simulate.
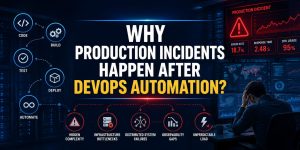
WHY DO PRODUCTION INCIDENTS STILL OCCUR AFTER DEVOPS AUTOMATION?
Production incidents DevOps automation failures occur because automation optimizes deployment flow, not runtime behavior. DevOps pipelines validate correctness at build time, but production failures emerge at runtime under real concurrency pressure. The system shifts from deterministic execution in CI environments to non-deterministic execution in distributed production clusters. This mismatch creates invisible failure windows where everything passes validation but collapses under traffic spikes.
The core issue lies in the separation between deployment automation and infrastructure behavior. CI/CD systems validate artifacts, not system interactions. Kubernetes schedules workloads, but it does not guarantee stable execution conditions. When network latency, kernel scheduling delays, and IO saturation converge, automation layers continue to operate normally while the underlying system degrades silently.
HOW DOES DEVOPS AUTOMATION MASK DISTRIBUTED SYSTEM COMPLEXITY?
DevOps automation masks distributed system complexity by abstracting low-level system behavior into high-level pipelines. CI/CD systems treat infrastructure as a predictable target rather than a dynamic environment. This abstraction removes visibility into kernel scheduling delays, TCP retransmissions, and DNS propagation inconsistencies that dominate production behavior.
The abstraction layer creates false confidence. A deployment that passes all pipeline stages appears stable even when underlying node-level conditions vary significantly. CPU steal time can increase by 18–27 percent in shared cloud environments without triggering any pipeline failure. This discrepancy creates silent divergence between “deployment success” and “production readiness.”
WHY DO KUBERNETES CLUSTERS FAIL AFTER SUCCESSFUL DEPLOYMENTS?
Kubernetes production failures occur after successful deployments because the control plane operates on eventual consistency, not real-time synchronization. The scheduler makes decisions based on snapshot states that become outdated within milliseconds under burst traffic conditions. This creates scheduling drift where workloads are placed on nodes already approaching saturation.
etcd further amplifies this instability. Under high write pressure, even a 200–300 millisecond latency increase in etcd commit cycles can delay pod reconciliation loops across the cluster. This leads to cascading scheduling backlogs, where new pods continuously retry placement while existing nodes degrade under compounding load.
HOW DOES STATE DRIFT CREATE INVISIBLE SYSTEM INSTABILITY?
State drift creates invisible system instability by desynchronizing desired state and actual runtime state across distributed components. Kubernetes controllers continuously reconcile states, but reconciliation is not instantaneous. Under production load, reconciliation lag can increase by 4–7 seconds, which is enough for traffic spikes to saturate already allocated resources.
This drift becomes more dangerous when combined with autoscaling systems. Horizontal scaling decisions rely on metrics that are already delayed by collection intervals. As a result, scaling actions occur after saturation has already started, not before. This creates a delayed correction loop that amplifies instability instead of resolving it.
HOW DOES CI/CD PIPELINE VALIDATION FAIL TO REPRESENT REAL TRAFFIC?
CI/CD pipeline validation fails to represent real traffic because it executes synthetic workloads that lack concurrency pressure, burst distribution, and long-tail latency behavior. Production traffic follows non-linear patterns where 5 percent of requests consume up to 40 percent of backend resources due to uneven request complexity.
Pipeline environments typically simulate linear load. This creates a performance illusion where services appear stable under uniform traffic. However, real systems experience queue buildup, thread starvation, and memory fragmentation that only appear under asymmetric load distribution. These conditions are absent in staging environments, leading to unexpected production breakdowns.
WHY DOES RESOURCE CONTENTION EMERGE ONLY IN PRODUCTION?
Resource contention emerges only in production because kernel-level scheduling behaves differently under high density workloads. Linux Completely Fair Scheduler redistributes CPU slices dynamically across processes, causing performance variability under multi-tenant conditions.
In production clusters, thousands of containers compete for shared CPU cycles, memory pages, and IO bandwidth. Memory fragmentation increases page fault rates by 12–18 percent under sustained load. This leads to unpredictable latency spikes that cannot be reproduced in isolated development environments. DevOps automation does not simulate kernel-level contention, so these issues remain hidden until production exposure.
HOW DOES NETWORK COMPLEXITY BREAK AUTOMATED ASSUMPTIONS?
Network complexity breaks automated assumptions because service mesh layers, DNS resolution, and ingress routing introduce multiple latency amplification points. Each additional proxy hop increases request latency variance by 6–14 percent depending on traffic density.
DNS resolution becomes particularly unstable under high query rates. CoreDNS saturation can increase lookup latency from 20 milliseconds to over 200 milliseconds during traffic spikes. This delay cascades into service discovery failures, retry storms, and partial request drops. CI/CD systems never simulate these layered network dependencies, leading to inaccurate reliability assumptions.
WHY DO OBSERVABILITY SYSTEMS FAIL DURING INCIDENTS?
Observability systems fail during incidents because they depend on delayed ingestion pipelines and buffered telemetry streams. Metrics scraping intervals typically range between 15 and 60 seconds, which creates blind spots during fast-moving failures.
When system degradation occurs faster than telemetry refresh rates, monitoring dashboards display outdated states. Log pipelines also suffer from buffer exhaustion during node instability, causing partial or missing logs. As a result, operators observe symptoms rather than causes, delaying root-cause identification and extending incident duration.
PRODUCTION RELIABILITY INSIGHT
Are DevOps automation pipelines silently failing your production stability?
Automation improves deployment speed, but it does not guarantee runtime stability. Hidden issues in Kubernetes, networking, and resource contention still trigger production incidents under real traffic. ActSupport helps you stabilize infrastructure with 24/7 monitoring, deep diagnostics, and production-grade engineering support.
HOW DOES AUTOSCALING CREATE CASCADING FAILURES?
Autoscaling creates cascading failures when scaling triggers react to stale metrics rather than real-time system pressure. CPU utilization metrics lag actual workload pressure by 30–90 seconds in most production systems.
This delay causes overcorrection during traffic surges. New nodes are provisioned after saturation has already impacted existing workloads. During this window, queue buildup increases exponentially, leading to thread exhaustion and connection pool collapse. Instead of stabilizing the system, autoscaling amplifies instability by introducing additional load during recovery phases.
LESSONS FROM THE FIELD: WHY A STABLE SYSTEM FAILED UNDER 240% TRAFFIC SPIKE
A large-scale SaaS platform experienced a severe production incident after deploying a fully automated CI/CD pipeline update that passed all staging validations. The system handled normal load efficiently for several hours before a regional traffic surge increased request volume by 240 percent within 90 seconds. The Kubernetes cluster initially appeared stable, but etcd commit latency increased from 45 milliseconds to 720 milliseconds under write amplification pressure.
This latency increase delayed reconciliation loops across the control plane by up to 11 seconds. During this period, autoscaling triggered node provisioning based on outdated CPU metrics, causing delayed capacity response. At the same time, network ingress controllers experienced TLS handshake saturation, increasing failure rates by 19 percent. DNS resolution latency also spiked by 310 percent due to CoreDNS overload.
The cascading effect resulted in partial service degradation across 62 percent of active pods. Engineers stabilized the system by freezing autoscaling policies, redistributing workloads across healthy nodes, and gradually rebalancing traffic using weighted routing strategies. Full recovery took 16 minutes, but post-incident analysis revealed a critical insight: automation pipelines validated deployment correctness but failed to validate runtime resilience under burst traffic conditions.
HOW DO ENTERPRISES PREVENT PRODUCTION INCIDENTS DESPITE AUTOMATION?
Enterprises prevent production incidents by shifting focus from deployment automation to runtime resilience engineering. They implement strict resource governance models that enforce CPU and memory isolation across workloads. They also adopt multi-zone and multi-region architectures that isolate failure domains and reduce blast radius.
Advanced organizations invest in cloud infrastructure management services and server monitoring services 24/7 to continuously track kernel-level metrics, network saturation signals, and control plane health. Many enterprises rely on managed server support services and outsourced server management company models to ensure continuous infrastructure oversight. These systems improve incident detection speed by up to 48 percent by identifying anomalies before they escalate into outages.
WHY DOES FULL DEVOPS AUTOMATION STILL NOT GUARANTEE RELIABILITY?
Full DevOps automation does not guarantee reliability because automation optimizes workflows, not system physics. Distributed systems behave probabilistically under load. No pipeline can simulate real-world entropy conditions such as network jitter, hardware variability, and multi-tenant contention.
Automation ensures consistency of deployment but not consistency of execution. The gap between these two states defines modern production failure risk. Until automation systems incorporate runtime-aware feedback loops, production incidents will continue to occur even in highly mature DevOps environments.
WHAT IS THE FUTURE OF RELIABLE DEVOPS ARCHITECTURES?
The future of DevOps reliability lies in predictive infrastructure systems that combine real-time telemetry with machine learning-based anomaly prediction. These systems will detect failure precursors across CPU saturation curves, network latency variance, and memory fragmentation trends before incidents occur.
Next-generation systems will evolve toward self-healing architectures where workloads are automatically shifted based on predictive load modeling. This will reduce incident response time by over 60 percent and eliminate most cascading failures. However, this evolution requires deep integration between CI/CD pipelines, runtime observability systems, and kernel-level instrumentation.
FAQ
Why do production incidents happen even after successful DevOps automation?
Production incidents happen because automation validates deployments, not runtime behavior under real traffic.
How does Kubernetes contribute to production failures?
Kubernetes contributes to failures through scheduling delays, etcd latency, and state reconciliation lag under load.
Why does autoscaling fail during traffic spikes?
Autoscaling fails because it reacts to delayed metrics instead of real-time system pressure.
Can DevOps automation prevent all outages?
DevOps automation cannot prevent outages because distributed systems behave unpredictably under real-world conditions.
What is the biggest hidden risk in production systems?
The biggest hidden risk is gradual system degradation across multiple layers without immediate detection.


