




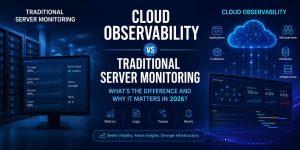
What Is Cloud Observability and Why Does It Matter?
Cloud observability is the ability to understand the internal state of distributed cloud infrastructure by continuously analyzing metrics, logs, traces, and events in real time. Unlike traditional monitoring, which focuses primarily on infrastructure health, Cloud Observability enables engineers to investigate why an issue occurred, how it propagated across multiple services, and which application components contributed to the failure. As organizations increasingly adopt Kubernetes, serverless computing, containers, multi-cloud deployments, and microservices, observability has become essential for maintaining operational visibility across highly dynamic environments.
Modern cloud platforms create infrastructure that changes every minute. Virtual machines scale automatically, containers are continuously created and destroyed, and application workloads move across clusters without manual intervention. These dynamic environments generate millions of operational signals every hour, making traditional infrastructure monitoring insufficient for identifying the root cause of complex failures. Cloud observability combines infrastructure metrics, distributed tracing, application telemetry, and intelligent analytics into a unified operational model that enables engineering teams to identify failures faster and maintain higher service availability.
Why Is Traditional Server Monitoring No Longer Enough?
Traditional server monitoring focuses on measuring infrastructure health rather than understanding application behavior across distributed environments. For many years, monitoring solutions collected processor utilization, memory consumption, disk capacity, storage performance, network bandwidth, and service availability. These metrics remain important because they indicate whether operating systems and hardware continue functioning within expected thresholds. However, modern cloud applications rarely depend upon a single server. Customer requests now travel through load balancers, API gateways, Kubernetes clusters, service meshes, databases, caching platforms, message queues, authentication services, and third-party APIs before generating a response.
A production environment may report normal CPU utilization and sufficient memory while customers continue experiencing slow applications or failed transactions. Traditional monitoring identifies healthy infrastructure but cannot explain failures occurring inside distributed applications. This limitation increases Mean Time to Detect (MTTD) and Mean Time to Recover (MTTR), resulting in prolonged outages and reduced customer satisfaction. Organizations delivering managed server support services increasingly complement infrastructure monitoring with observability platforms capable of analyzing application behavior throughout the entire request lifecycle.
How Does Cloud Observability Differ From Traditional Monitoring?
Cloud observability provides contextual intelligence, while traditional monitoring primarily reports infrastructure status. Monitoring answers questions such as whether a server is online, how much memory is available, or whether a service is responding to requests. Observability goes several layers deeper by revealing why latency increased, where requests experienced delays, which service introduced failures, and how infrastructure events affected application performance.
For example, a customer request entering a cloud-hosted eCommerce application may pass through a web application firewall, load balancer, Kubernetes ingress controller, API gateway, authentication service, inventory microservice, payment gateway, Redis cache, and relational database before completing successfully. If latency suddenly increases, traditional monitoring may indicate healthy CPU utilization across every server. Cloud observability reconstructs the entire transaction path using distributed traces, allowing engineers to identify the exact service responsible for increased response times. This contextual visibility dramatically reduces troubleshooting time while improving operational efficiency.
Why Has Cloud-Native Architecture Changed Infrastructure Operations?
Cloud-native architecture distributes application workloads across numerous loosely coupled services instead of relying on monolithic server deployments. Modern software platforms increasingly use containers, Kubernetes orchestration, service meshes, event-driven communication, serverless functions, and managed cloud databases to improve scalability and resilience. Each application request may traverse dozens of independent services, each generating its own operational metrics, logs, and traces.
This architectural transformation creates substantial operational complexity. A single user transaction may involve hundreds of network calls across multiple cloud regions before returning a response. Infrastructure engineers therefore require significantly greater operational visibility than traditional monitoring can provide. Cloud infrastructure management services increasingly rely on observability platforms capable of correlating telemetry data across every infrastructure layer, enabling rapid identification of cascading failures within distributed systems.
Why Are Metrics Still Important in Cloud Observability?
Metrics remain the foundation of infrastructure monitoring because they provide quantitative measurements describing system performance over time. Metrics continuously measure processor utilization, memory allocation, storage latency, disk input and output operations, network throughput, request rates, database connections, container utilization, and application response times. These measurements allow engineering teams to identify abnormal trends before service degradation becomes customer-facing.
Cloud observability enhances traditional metrics by correlating them with application logs and distributed traces. Rather than viewing processor utilization independently, engineers can associate increased CPU consumption with specific API endpoints, individual microservices, or database transactions. This contextual relationship accelerates root cause analysis while improving operational decision-making across enterprise cloud environments.
CLOUD OBSERVABILITY • 24/7 INFRASTRUCTURE OPERATIONS • MANAGED SERVER SUPPORT
Need Complete Visibility Across Your Cloud Infrastructure?
Modern cloud infrastructure demands more than traditional server monitoring. ActSupport provides Cloud Infrastructure Management Services, Managed Server Support Services, and 24/7 Server Management Services to maximize uptime, improve security, and keep your production environment running at peak performance.
- ✅ 24/7 Cloud Infrastructure Monitoring & Incident Response
- ✅ AWS, Azure & Google Cloud Infrastructure Management
- ✅ Linux Server Administration & Performance Optimization
- ✅ Kubernetes & Container Infrastructure Support
- ✅ Cloud Security Hardening & Patch Management
- ✅ Infrastructure Troubleshooting & Root Cause Analysis
- ✅ White Label & Remote Server Management Services
- ✅ Proactive Monitoring, Observability & SLA Management
Partner with ActSupport for reliable, scalable cloud and server management backed by 24/7 expert support.
How Do Logs, Metrics, and Traces Work Together in Cloud Observability?
Logs, metrics, and distributed traces form the three core pillars of cloud observability because each provides a different perspective on infrastructure and application behavior. Metrics measure numerical values over time, including processor utilization, memory consumption, request latency, network throughput, and storage performance. These values help engineers identify performance trends and determine whether a system is operating within expected thresholds. Logs capture detailed records of events generated by operating systems, web servers, applications, databases, authentication services, and security platforms. They explain what happened by recording errors, warnings, configuration changes, user activity, and service events. Distributed traces connect every component involved in a single user request, allowing engineers to visualize the complete journey of an application transaction across multiple services. Individually, each data source offers valuable information. Combined, they provide complete operational visibility that traditional server monitoring cannot achieve.
Why Are Distributed Traces Essential for Modern Cloud Applications?
Distributed tracing enables engineers to follow a single transaction as it moves through multiple services within a cloud-native application. Modern applications rarely process user requests inside a single server. A customer accessing an online application may interact with a load balancer, API gateway, authentication service, Kubernetes ingress controller, inventory service, payment processor, caching platform, messaging queue, and relational database before receiving a response. Each service introduces network latency, processing delays, and potential failure points. Distributed tracing assigns a unique trace identifier to every request, enabling engineers to reconstruct the complete execution path. Instead of investigating dozens of unrelated logs across multiple servers, engineering teams can immediately identify where latency increased, which dependency failed, and how downstream services were affected. This capability dramatically shortens troubleshooting time while improving service reliability.
Why Does Kubernetes Require a Different Monitoring Strategy?
Kubernetes continuously creates, terminates, and relocates application workloads, making static infrastructure monitoring insufficient for containerized environments. Traditional monitoring assumes servers remain operational for extended periods and maintain relatively stable workloads. Kubernetes replaces this assumption with dynamic orchestration where pods are rescheduled, nodes scale automatically, and containers restart whenever health checks fail. These frequent infrastructure changes generate massive volumes of telemetry that quickly overwhelm legacy monitoring systems. Cloud observability platforms continuously discover newly created workloads, collect telemetry automatically, and maintain visibility even as applications scale horizontally across clusters. This dynamic discovery ensures engineering teams retain complete operational awareness without manually updating monitoring configurations whenever infrastructure changes occur.
How Does OpenTelemetry Standardize Cloud Observability?
OpenTelemetry has become the industry standard for collecting observability data across modern cloud environments. Organizations previously relied on vendor-specific monitoring agents that generated incompatible telemetry formats and limited data portability. OpenTelemetry solves this challenge by providing a unified framework for collecting metrics, logs, and distributed traces using standardized instrumentation libraries. Applications instrumented with OpenTelemetry generate consistent telemetry regardless of whether they run on virtual machines, Kubernetes clusters, serverless platforms, or hybrid cloud environments. This standardization enables organizations to migrate between observability platforms without rewriting application instrumentation while ensuring consistent operational visibility across heterogeneous infrastructure.
One commonly used command to verify OpenTelemetry Collector availability is: systemctl status otelcol
This simple verification confirms whether the telemetry collection service is running. In production environments, however, observability platforms continuously monitor collector health and automatically alert administrators if telemetry pipelines become unavailable.
Why Is AWS Observability More Complex Than Monitoring Individual Servers?
AWS environments consist of interconnected managed services that require visibility beyond operating system performance metrics. A single cloud application may depend on Amazon EC2 instances, Elastic Load Balancers, Auto Scaling Groups, Amazon RDS databases, Amazon S3 storage, Amazon EKS clusters, AWS Lambda functions, Amazon CloudFront, Amazon Route 53, and managed message queues. Infrastructure issues often emerge from interactions between these services rather than individual server failures. Comprehensive AWS server management services therefore integrate infrastructure metrics, service health information, application telemetry, distributed traces, and cloud-native event streams into a unified observability platform. This holistic approach enables engineering teams to identify dependency failures before they affect customer-facing applications.
Why Does AI-Powered Observability Improve Incident Response?
Artificial intelligence accelerates incident response by identifying patterns that human operators cannot easily recognize across millions of operational events. Large enterprise environments generate enormous quantities of telemetry every minute. Infrastructure metrics, application logs, security events, container lifecycle updates, network statistics, and cloud service notifications frequently produce hundreds of thousands of alerts every day. Many alerts represent symptoms rather than root causes. AI-powered observability platforms analyze historical operational behavior, correlate related events, suppress duplicate alerts, and prioritize incidents based on business impact. This intelligent correlation reduces alert fatigue while enabling engineers to focus on resolving the underlying infrastructure problem instead of manually investigating isolated symptoms.
Why Is Root Cause Analysis Faster With Cloud Observability?
Cloud observability reduces investigation time by connecting infrastructure behavior directly with application performance and user experience. Traditional troubleshooting often requires administrators to examine multiple dashboards independently before identifying the origin of an outage. Engineers review server metrics, application logs, network statistics, database performance, and cloud service events separately before manually correlating the information. Observability platforms automate this process by linking metrics, traces, logs, and infrastructure topology into a unified operational timeline. When a production incident occurs, engineers immediately understand which service failed, how the failure propagated through dependent components, and which customer transactions experienced disruption. This contextual intelligence significantly improves operational efficiency while reducing service restoration time.
Lessons from the Field: How Cloud Observability Prevented a Major Hosting Outage
A proactive observability strategy can prevent widespread customer downtime by identifying infrastructure degradation before it becomes a production incident. During a simulated enterprise hosting scenario, an infrastructure provider operating more than 2,500 Linux virtual machines observed intermittent latency affecting customer websites hosted across multiple Kubernetes clusters. Traditional monitoring reported healthy CPU utilization below 42 percent, memory utilization remained under 68 percent, and network throughput appeared normal. Despite these healthy infrastructure metrics, customers experienced application response times exceeding 2.8 seconds during peak traffic.
Cloud observability revealed that the increased latency originated from a distributed storage subsystem supporting persistent Kubernetes volumes. Distributed traces demonstrated that application requests consistently stalled while waiting for storage operations. Log correlation identified intermittent storage controller timeout events that occurred only during high write activity, while infrastructure metrics showed storage latency increasing from an average of 3 milliseconds to nearly 48 milliseconds. Engineers determined that firmware inconsistencies within one storage controller caused delayed I/O acknowledgments under sustained workloads. After migrating persistent volumes to a healthy storage cluster and updating controller firmware during a scheduled maintenance window, average application response time decreased from 2.8 seconds to 1.4 seconds, storage latency returned below 4 milliseconds, and infrastructure availability improved from 99.91 percent to 99.99 percent. Without observability, administrators would likely have continued investigating healthy application servers while overlooking the true storage bottleneck.
Why Are Enterprises Transitioning from Traditional Monitoring to Cloud Observability?
Enterprise infrastructure has become too distributed for traditional server monitoring alone to provide complete operational visibility. Organizations now operate applications across public clouds, private clouds, Kubernetes clusters, virtual machines, serverless platforms, edge locations, and Software-as-a-Service integrations. A single customer transaction may interact with dozens of independent components before generating a response. Traditional monitoring tools continue to play an important role by measuring server health, processor utilization, memory usage, storage performance, and network connectivity. However, they often lack the contextual intelligence needed to explain how failures propagate across distributed services. Cloud Observability bridges this gap by correlating metrics, logs, traces, infrastructure topology, and application dependencies into a unified operational view. Engineering teams no longer spend hours switching between dashboards because observability platforms automatically connect related events, allowing them to identify root causes within minutes rather than hours.
How Does Cloud Observability Improve Service Level Agreements?
Faster incident detection and root cause analysis directly improve Service Level Agreement (SLA) performance. Every minute of downtime affects customer confidence, operational costs, and contractual commitments. Organizations that rely solely on infrastructure alerts often spend valuable time determining whether the problem originates from compute resources, storage systems, networking, databases, or application services. Observability platforms reduce this uncertainty by presenting correlated telemetry that identifies the precise component responsible for service degradation. This capability reduces Mean Time to Detect (MTTD) and Mean Time to Recover (MTTR), enabling infrastructure teams to restore production services more efficiently. Businesses providing managed server support services, 24/7 server management services, and remote server management services increasingly adopt observability to maintain consistent uptime, meet customer expectations, and support demanding enterprise SLAs.
Why Does Cloud Observability Deliver Better Business Value Than Reactive Monitoring?
Operational visibility generates measurable business value by reducing downtime, improving engineering productivity, and optimizing infrastructure investments. Every production outage results in lost revenue, increased support requests, delayed engineering projects, and reduced customer satisfaction. Observability minimizes these risks by enabling proactive incident detection, predictive capacity planning, and intelligent performance optimization. Engineering teams spend less time manually collecting diagnostic information and more time implementing architectural improvements that enhance reliability and scalability. Organizations also gain valuable insights into application behavior, resource utilization, and infrastructure efficiency, helping them right-size cloud resources and reduce unnecessary operational expenditure. For businesses delivering hosting services or managing enterprise infrastructure, observability transforms infrastructure operations from reactive maintenance into proactive business enablement.
Why Are Managed Cloud Operations Increasingly Based on Observability?
Modern cloud operations require continuous insight across infrastructure, applications, networking, and security to maintain reliable digital services. Organizations managing hybrid infrastructure, Kubernetes clusters, multi-cloud deployments, and distributed applications increasingly depend on observability to maintain operational consistency. Providers delivering cloud infrastructure management services, AWS server management services, linux server management services, white label server support, and outsourced hosting support services benefit from unified telemetry that simplifies operational management across diverse customer environments. Rather than maintaining multiple disconnected monitoring platforms, engineering teams can investigate incidents from a single operational interface, improving efficiency while reducing response times.
What Best Practices Help Organizations Build an Effective Cloud Observability Strategy?
Successful observability initiatives begin with complete telemetry collection and consistent operational standards across every infrastructure layer. Organizations should instrument applications using OpenTelemetry-compatible frameworks, centralize metrics, logs, and traces within a unified observability platform, establish meaningful service-level objectives, and define alert thresholds based on customer experience rather than infrastructure utilization alone. Observability data should be retained long enough to support trend analysis, capacity planning, compliance requirements, and post-incident investigations. Engineering teams should regularly validate dashboards, automate telemetry collection, review alert quality, and eliminate unnecessary notifications that contribute to alert fatigue. Integrating observability into deployment pipelines also enables rapid validation of infrastructure changes before they affect production environments.
What Does the Future of Cloud Observability Look Like Beyond 2026?
Cloud observability is evolving from infrastructure monitoring into intelligent operational decision-making powered by automation and artificial intelligence. Future observability platforms will increasingly combine machine learning, predictive analytics, anomaly detection, automated remediation, distributed tracing, and business impact analysis into unified operational ecosystems. Artificial intelligence will continuously analyze infrastructure behavior, identify emerging performance degradation, recommend corrective actions, and automate common remediation tasks while maintaining human oversight for critical production decisions. As organizations continue adopting edge computing, serverless architectures, AI workloads, and globally distributed applications, observability will become the primary operational discipline responsible for maintaining availability, security, and performance across increasingly complex digital ecosystems.
What Should Businesses Remember About Cloud Observability?
Cloud observability has become an essential capability for organizations operating modern cloud-native infrastructure. Traditional server monitoring continues to provide valuable visibility into hardware and operating system health, but it cannot independently explain the complex interactions occurring within distributed applications. Cloud Observability extends operational intelligence by combining metrics, logs, traces, topology awareness, and contextual analytics into a comprehensive understanding of infrastructure behavior. Organizations that invest in observability improve operational resilience, accelerate incident response, strengthen security, optimize cloud spending, and deliver superior customer experiences. As digital transformation continues across every industry, observability will remain one of the most valuable investments organizations can make to ensure reliable, scalable, and high-performing cloud infrastructure.
Cloud Observability FAQ
Have questions about Cloud Observability, Server Monitoring, or modern cloud infrastructure? Here are answers to the most frequently asked questions from businesses, hosting providers, and DevOps teams.