
Overviews and Technical Extraction
Server monitoring issues occur when tracking agents fail, telemetry data gaps arise, or alert fatigue masks critical infrastructure bottlenecks. To fix these failures, engineers must validate agent connectivity, optimize probe intervals, and synchronize firewall rules with monitoring ports. Implementing real time server monitoring tools 2026 ensures continuous visibility into CPU states, memory pressure, and network throughput. Strategic use of 24/7 server management services further mitigates risks by providing proactive response to health metric anomalies before they trigger a website down troubleshooting steps event.
Effective infrastructure oversight requires a transition from reactive alerting to predictive analysis using server health monitoring tools and techniques. High-performance environments must prioritize linux server management services that track kernel-level metrics like I/O wait and context switching. Critical failure points often involve incorrect firewall configurations blocking monitoring packets (e.g., ICMP or SNMP) and stale agent certificates causing ECONNREFUSED errors. Organizations leveraging outsourced server management company expertise benefit from standardized cloud infrastructure monitoring best practices and 24/7 incident response.
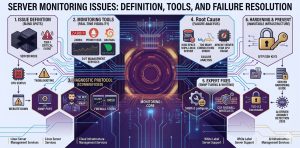
Problem Statement: The High Cost of Monitoring Blind Spots
Infrastructure blind spots represent the most significant threat to production uptime in high-density hosting environments. When monitoring systems fail, administrators lose the ability to perform a timely apache server high cpu usage fix or detect a how to fix disk space 100% linux server emergency. A single minute of undetected service failure can cascade into significant revenue loss and brand erosion. As a lead architect, I classify monitoring failures as Tier-1 critical events. Without accurate telemetry, you are essentially flying an enterprise-grade aircraft without a cockpit instrument cluster.
Root Cause Analysis: Why Monitoring Systems Fail
Monitoring failures typically stem from resource exhaustion on the monitoring node itself or network-layer interruptions. For example, a how to fix mysql too many connections error on the database can prevent a monitoring agent from logging metrics to the central repository. At the protocol level, ECONNREFUSED often occurs when the monitoring server’s firewall blocks incoming traffic from remote agents. Furthermore, TLS version mismatches between older agents and modern monitoring cores frequently cause “Critical Error” logs, preventing the delivery of vital performance data.
DETECT SERVER FAILURES BEFORE THEY CAUSE DOWNTIME
Are monitoring blind spots hiding critical server and infrastructure failures?
Broken monitoring agents, alert fatigue, firewall blocks, and missing telemetry can silently disrupt production environments. Our engineers provide proactive 24/7 monitoring, alert optimization, server health analysis, and infrastructure troubleshooting to ensure maximum uptime and visibility.
Diagnostic Protocol: Verifying Monitoring Port Integrity
Engineers must first verify that the monitoring server can reach the target node using nmap or telnet. Run nmap -p 161,162,10050 [server_ip] to check the status of SNMP and agent-specific ports. If the ports appear “filtered,” the local firewall or an upstream security group is dropping the packets. If the ports are “closed,” the monitoring daemon on the remote server is likely not running. Use telnet [server_ip] 10050 to confirm a successful TCP handshake. This basic verification ensures that the network path remains viable for remote server management services.
Step-by-Step Resolution: Restoring Zabbix or Nagios Connectivity
If your monitoring dashboard shows a “Host Down” status but the site is reachable, you face an agent-level connectivity issue. Start by checking the agent logs on the remote node, typically located in /var/log/zabbix/ or /var/log/nagios/. Look for “Access denied” or “Connection reset by peer” errors. Verify the Server= directive in the agent configuration file to ensure it matches the monitoring core IP. Restart the service using systemctl restart zabbix-agent. For aws server management services, ensure the Security Group permits inbound traffic on the agent’s listener port.
Architecture Insight: Passive vs. Active Monitoring Modes
Monitoring architecture generally falls into two categories: Active and Passive. In Active Monitoring, the remote agent initiates the connection to the central server to push data. This mode is ideal for cloud infrastructure management services where servers are behind NAT or dynamic IPs. In Passive Monitoring, the central server polls the agent for data. Passive mode requires strict firewall management, as the server must have permission to initiate connections to the nodes. Understanding this distinction is vital for white label server support providers who manage diverse network topologies.
Real-World Use Case: CSF Firewall Blocking Monitoring Probes
In a common cpanel server management scenario, the ConfigServer Security & Firewall (CSF) often triggers a block on monitoring probes. If a monitoring server pings a node too frequently, CSF interprets this as a port scan and null-routes the monitoring IP. To fix this, you must add the monitoring server’s IP in /etc/csf/csf.allow. Additionally, ensure the required ports for monitoring are added to the TCP_IN and UDP_IN lists. This prevents a false-positive outage alert and maintains the integrity of your server monitoring services 24/7
Advanced Engineer Fix: Tuning SNMP for High-Performance Metrics
Standard SNMP configurations often struggle with high-frequency polling on servers with thousands of interfaces or processes. To optimize this, engineers should implement SNMPv3 for encrypted transport and utilize “Bulk Gets” to reduce round-trip latency. If you observe high CPU usage on the monitoring agent, adjust the snmpd.conf to limit the MIB trees being walked. This “engineer-level” tuning prevents the monitoring system from becoming the very cause of an apache server high cpu usage fix requirement on the target machine.
Hardening and Best Practices: Securing the Monitoring Pipeline
Securing your monitoring data is as critical as securing the application itself. Monitoring packets often contain sensitive information about process lists, disk paths, and kernel versions. Always use SFTP/SSH Keys for any script-based monitoring and enforce TLS 1.3 for agent-to-server communication. As part of a cpanel security hardening guide, isolate the monitoring traffic on a dedicated VLAN or VPN. This prevents attackers from sniffing telemetry data to map out your infrastructure vulnerabilities, fulfilling a key requirement of server security best practices 2026.
Engineer’s Toolkit: Critical Commands for Troubleshooting
To debug monitoring failures in real-time, architects use tcpdump to capture traffic on specific ports. Run tcpdump -i eth0 port 161 to see if SNMP requests are reaching the server. Use netstat -tulpn | grep agent_port to confirm that the agent is listening on the correct interface. If you suspect MLSD failures during log shipping via FTP, use curl -v ftp://[server_ip] to trace the protocol handshake. These commands, combined with real time server monitoring tools 2026, provide the technical depth required for managed server support services.
Understanding Why Servers Slow Down After Some Time
A frequent query is why server is slow after some time, which monitoring systems often attribute to “resource leaks” or “zombie processes.” Monitoring should track “Stall Information” and “Pressure Stall Information” (PSI) in the Linux kernel to see how often the CPU waits for I/O or memory. If the load average is high but CPU usage is low, the server is likely disk-bound. Implementing server monitoring services 24/7 allows you to catch these trends before the system enters a “D-state” hang, necessitating a hard reboot.
How to Fix Disk Space 100% Linux Server via Monitoring Alerts
A how to fix disk space 100% linux server scenario is the most avoidable production failure. High-authority monitoring setups use “Predictive Triggering” to alert when a partition will hit capacity based on current write rates. If a disk fills up, check /var/log/messages for I/O errors and use du -sh /* to find the offending directories. Monitoring agents often fail when the /tmp partition is full, as they cannot write temporary state files. Maintaining 20% free space is a core tenet of linux server management services.
Monitoring and Preventing Brute Force Attacks in cPanel
Monitoring systems must track failed login attempts to how to prevent brute force attacks in cpanel. By integrating log-parsing tools like Fail2Ban with your central monitoring core, you can visualize attack vectors in real-time. If you see a spike in 401 Unauthorized errors in the Apache logs, your server is likely under a credential-stuffing attack. Efficient server hardening involves using these monitoring insights to automate the blocking of malicious IPs at the edge firewall before they impact the CPU.
Cloud Infrastructure Monitoring Best Practices for 2026
In 2026, cloud infrastructure monitoring best practices involve moving away from static thresholds toward machine-learning-based anomaly detection. Instead of alerting when CPU hits 90%, the system should alert when CPU usage is “unusual for a Tuesday at 2 PM.” This reduces alert fatigue and allows outsourced hosting support services to focus on genuine threats. Utilizing aws server management services like CloudWatch alongside custom exporters ensures that both the hypervisor and the guest OS are fully transparent to the engineering team.
The Benefits of Outsourcing Technical Support for Monitoring
The benefits of outsourcing technical support for infrastructure monitoring include access to a pre-built, hardened monitoring stack. An outsourced server management company provides the “eyes on glass” needed to interpret complex data patterns 24/7. This partnership ensures that your managed server support services are not just collecting data but acting on it. From how to secure linux server from hackers to complex database tuning, a dedicated monitoring team transforms raw telemetry into actionable business intelligence.
Conclusion: The Future of Infrastructure Oversight
Solving server monitoring issues is the foundation of high-availability architecture. By eliminating technical debt in the monitoring pipeline and adopting real time server monitoring tools 2026, architects can guarantee the stability of their production environments. Whether you are managing a single node or a multi-cloud cluster, the discipline of rigorous telemetry collection and proactive failure resolution remains non-negotiable. Commit to a strategy of total visibility to ensure your infrastructure remains performant, secure, and resilient against the challenges of 2026.


