
The Evolution of Cloud Infrastructure Management
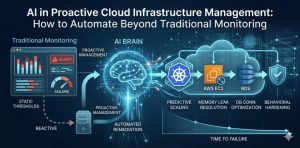
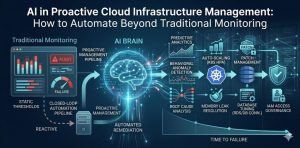
AI in proactive cloud infrastructure management represents a fundamental shift from reactive troubleshooting to predictive system health optimization. Traditional monitoring relies on static thresholds that only trigger alerts after a failure occurs. In contrast, artificial intelligence analyzes historical telemetry to identify subtle anomalies before they escalate into downtime. This approach integrates machine learning models directly into the DevOps pipeline to manage complex environments like AWS, Azure, and Google Cloud. Engineers now use these tools to maintain 99.99% uptime by resolving latent bottlenecks automatically.
The Critical Limitations of Traditional Monitoring
Traditional monitoring systems function on a simple “if-then” logic that fails in modern distributed architectures. These legacy tools often flood engineers with alert fatigue because they cannot distinguish between a transient spike and a systemic failure. Static thresholds require manual tuning, which rarely keeps pace with the dynamic scaling of containerized applications. When a cloud server hits 90% CPU usage, a traditional tool sends an alert, but it provides no context regarding the root cause. This reactive posture leads to increased Mean Time to Repair (MTTR) and potential revenue loss.
Why Infrastructure Failures Occur in Modern Clouds
Modern cloud failures typically stem from complex interdependencies between microservices rather than isolated hardware faults. Resource contention, memory leaks, and cascading API timeouts often hide behind normal performance metrics. Without AI, engineers struggle to correlate logs across thousands of ephemeral containers. Minor configuration drifts in Kubernetes or improperly scoped IAM roles can create vulnerabilities that traditional scanners miss. These underlying issues remain dormant until peak traffic triggers a catastrophic collapse. Proactive management identifies these “silent killers” by mapping baseline behavioral patterns.
Transitioning to Predictive AI Analytics
AI-driven management utilizes time-series forecasting to predict future resource requirements based on historical usage patterns. These systems employ Long Short-Term Memory (LSTM) networks to understand seasonal trends and sudden deviations. By analyzing metrics like disk I/O, network latency, and memory pressure, AI can project a “Time-to-Failure” estimate. Engineers receive warnings hours or days before a disk reaches capacity or a database connection pool exhausts. This foresight allows teams to perform maintenance during low-traffic windows, effectively eliminating emergency patches.
Implementing Automated Remediation Workflows
Engineers fix modern infrastructure issues by connecting AI insights to automated execution engines like Ansible, Terraform, or AWS Lambda. When an AI model detects a predicted memory exhaustion, it triggers a script to scale the instance or clear caches. This “closed-loop” automation reduces the need for human intervention in routine maintenance tasks. For instance, if an AI detects a slow-burning memory leak in a Java application, it can automatically initiate a graceful restart. These workflows ensure that the infrastructure self-heals while maintaining high availability.
Real-World Production Scenarios for AIOps
In a high-traffic e-commerce environment, AI manages the surge during flash sales by predicting traffic spikes minutes before they hit. While traditional auto-scaling reacts to current load, AI-driven scaling prepares the environment in advance. This prevents the “cold start” latency often associated with spinning up new cloud instances. Another scenario involves detecting “zombie” resources that consume costs without providing value. AI identifies underutilized EC2 instances or orphaned EBS volumes, suggesting immediate decommissioning to optimize cloud spend.
Analyzing System Logs with Machine Learning
Proactive management requires deep log analysis that exceeds human capability during a crisis. AI tools ingest millions of log lines from /var/log/syslog or application-specific outputs to find hidden correlations. For example, a slight increase in TCP Retransmission errors might precede a regional network outage. AI groups these disparate log entries into a single “incident,” providing engineers with a clear narrative of the event. This prevents the “needle in a haystack” problem during complex debugging sessions across distributed clusters.
Essential Commands for Infrastructure Diagnostics
Engineers still rely on low-level Linux commands to verify what the AI reports. To check real-time resource distribution, administrators use htop or atop to monitor process-level consumption. For network-related issues, commands like netstat -tulpn or ss -ant help identify stuck connections. To inspect log patterns manually, grep -i "error" /var/log/apache2/error.log | wc -l provides a quick frequency count. These manual checks validate the AI’s findings and ensure that the underlying server hardening remains intact.
Configuration Snippets for AI Integration
Integrating AI often involves configuring exporters to feed data into a centralized ML engine. A Prometheus configuration might include specific scrape intervals to ensure high-resolution data for the AI model.
YAML
scrape_configs:
  - job_name: 'cloud-metrics'
    scrape_interval: 10s
    static_configs:
      - targets: ['localhost:9100']
This frequent sampling allows the AI to catch micro-bursts that a 60-second interval would miss. Engineers also use CloudWatch agent configurations to push custom JSON logs for sentiment and anomaly analysis.
Monitoring Tools and the Modern Tech Stack
The modern proactive stack combines traditional powerhouses with specialized AI layers. Tools like Datadog, Dynatrace, and New Relic lead the market in built-in AIOps capabilities. For open-source enthusiasts, the ELK stack (Elasticsearch, Logstash, Kibana) now offers machine learning features for anomaly detection. Zabbix and Nagios remain relevant by acting as the primary data collection agents. These tools feed the “Brain” of the infrastructure, allowing for a unified view of health across hybrid cloud environments.
The Impact on Cloud Security and Hardening
AI enhances server hardening by detecting behavioral deviations that indicate a potential security breach. If a web server suddenly initiates an outbound SSH connection, AI flags this as a compromise. Traditional firewalls might allow the traffic, but behavioral analysis identifies it as an anomaly. Proactive management includes automated patch management where AI tests updates in a staging environment before production rollout. This ensures that security vulnerabilities are closed without risking system stability or application compatibility.
Best Practices for Experienced Server Engineers
Experienced engineers prioritize data quality over model complexity when implementing AI management. You must ensure that your monitoring agents are correctly installed and reporting clean data. Avoid “black box” automation by implementing “human-in-the-loop” approvals for high-risk changes like database deletions. Document every automated workflow within your version control system to maintain a clear audit trail. Finally, regularly retrain your AI models to account for changes in your application’s baseline performance.
Outsourced NOC Services and White Label Support
Many organizations leverage outsourced hosting support to manage the complexities of AI-driven infrastructure. White label support providers use advanced NOC services to monitor global fleets 24/7. These experts provide the specialized knowledge required to tune AI models and handle complex escalations. By using external 24/7 support, internal teams can focus on core product development while the infrastructure remains stable. This model provides enterprise-grade proactive management without the overhead of an in-house round-the-clock team.
Comparison: Reactive vs. Proactive Management
Reactive management is characterized by high stress, frequent downtime, and unpredictable workloads for DevOps teams. Proactive management focuses on stability, scheduled improvements, and data-driven decision-making. In a reactive setup, you fix the server after the website goes down. In a proactive setup, you expand the disk space because the AI predicted it would be full by Friday. The cost of proactive tools is often offset by the reduction in emergency labor and lost sales.
Case Study: Reducing Downtime in Fintech
A global fintech firm implemented AI-driven cloud monitoring to manage their AWS infrastructure. They previously suffered from intermittent API latency that frustrated users and triggered thousands of alerts. By deploying an anomaly detection model, they identified a recurring memory leak in a legacy microservice. The AI provided the exact timestamp and log correlation needed for the developers to fix the bug. Within three months, their MTTR dropped by 60%, and their overall system uptime reached 99.995%.
Practical Troubleshooting Insights
When AI flags an issue, engineers should first check the “Confidence Score” of the prediction. High-confidence alerts warrant immediate investigation, while low-confidence ones may require more data. Check the dmesg output on Linux servers to see if hardware-level errors correlate with the AI’s report. Use journalctl -u [service_name] to inspect the specific unit logs if an automated restart fails. Always verify that your AI tool has the necessary permissions to execute remediation scripts across your cloud accounts.
IMPLEMENT AI-DRIVEN PROACTIVE INFRASTRUCTURE MANAGEMENT
Are hidden infrastructure bottlenecks and reactive firefighting slowing down your business operations?
Traditional monitoring only alerts you after systems fail. Our engineers help implement AI-driven cloud infrastructure management, predictive monitoring, anomaly detection, automated remediation workflows, proactive server hardening, and 24/7 NOC support to identify failures before downtime impacts your customers, applications, and revenue.
Statistics on AI and Cloud Performance
Industry reports indicate that AIOps can reduce operational costs by up to 30% through better resource allocation. Organizations using proactive management see a 50% reduction in false-positive alerts compared to traditional methods. According to recent surveys, 75% of enterprises are now integrating some form of AI into their DevOps pipelines. These companies report a significant improvement in developer productivity as less time is spent on “toil” and manual firefighting. Uptime improvements typically range from 15% to 25% following full AI integration.
The Role of cPanel and WHM in AI Management
Even traditional platforms like cPanel and WHM are evolving to include smarter resource management features. AI plugins for cPanel can now predict when a shared hosting account is likely to exceed its IOPS limits. This allows hosters to migrate heavy users before they impact other tenants on the same server. Automated server hardening scripts within WHM can be triggered by AI to block malicious IP ranges dynamically. This brings enterprise-level proactive management to the world of managed web hosting.
Future Trends in Infrastructure Automation
The future of cloud management lies in “Autonomous Infrastructure” where the system manages its entire lifecycle. We are moving toward a state where AI writes the Terraform code required to scale based on business goals. Generative AI is already helping engineers write better Prometheus queries and complex Bash scripts. As models become more context-aware, the gap between human intent and machine execution will continue to shrink. Engineers will evolve into “Model Orchestrators” rather than manual system administrators.
Conclusion: Embracing the AI-Driven Future
Proactive cloud infrastructure management is no longer an optional luxury for modern digital businesses. Moving beyond traditional monitoring allows you to stay ahead of failures and optimize costs effectively. By integrating AI into your DevOps workflows, you transform your infrastructure from a cost center into a competitive advantage. Start small by implementing anomaly detection on your most critical services and gradually expand to full automation. The goal is a resilient, self-healing environment that supports continuous innovation.
Related Posts
May 28, 2026
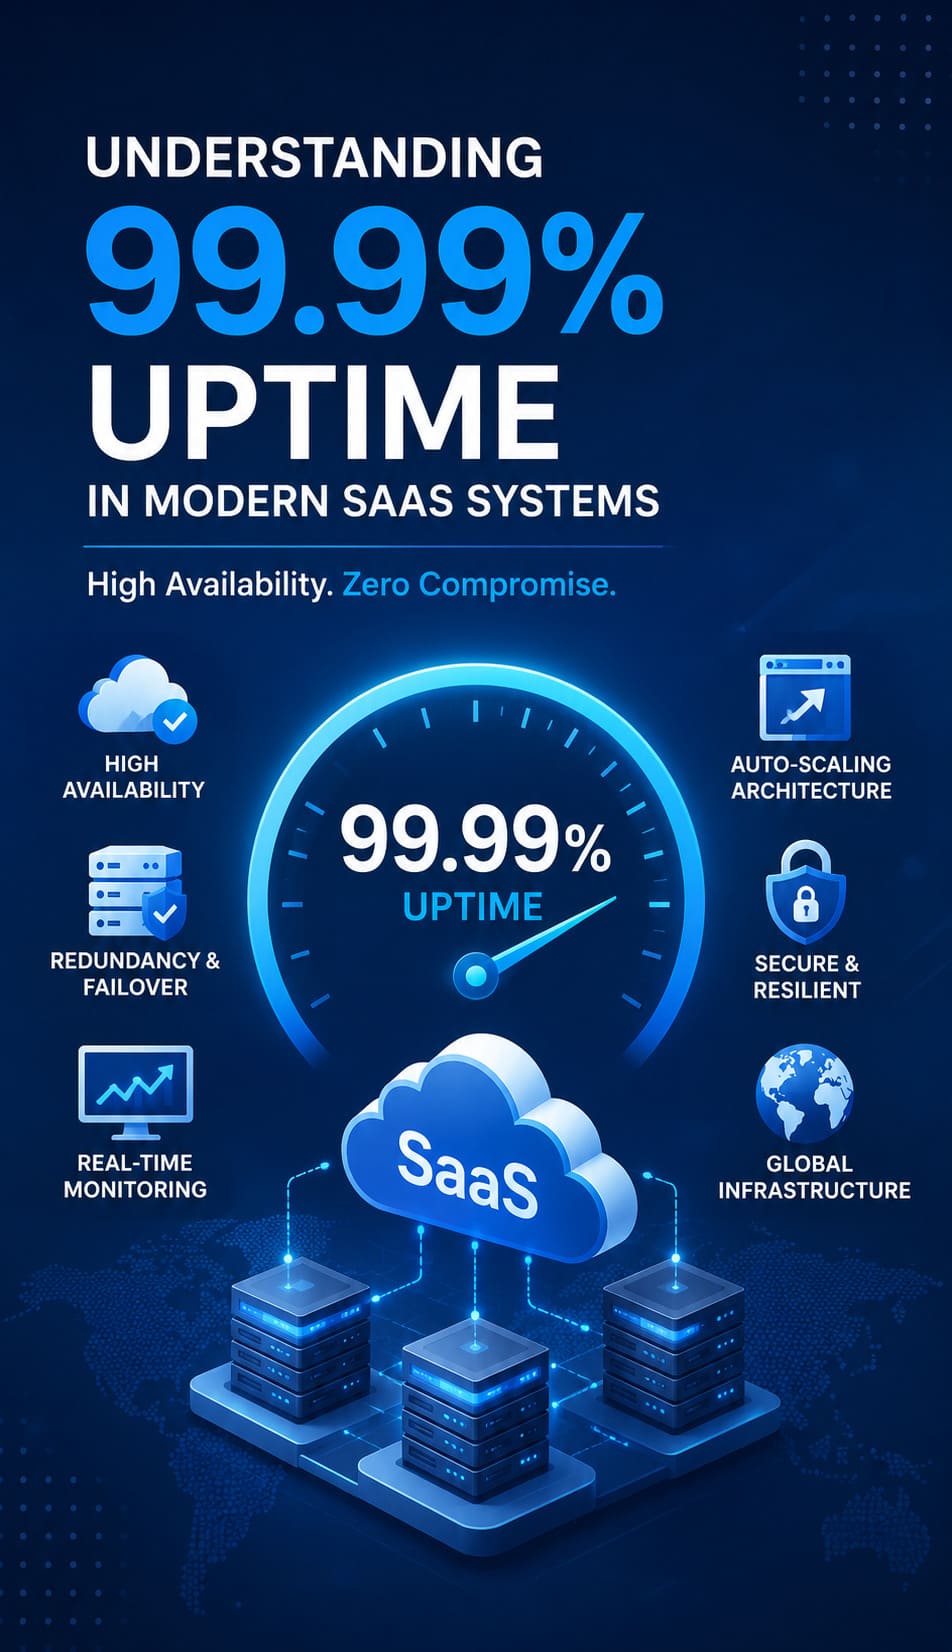
Understanding 99.99% Uptime in Modern SaaS Systems
Business-Critical Importance of High Availability In modern SaaS ecosystems, uptime is not just a technical…
May 27, 2026
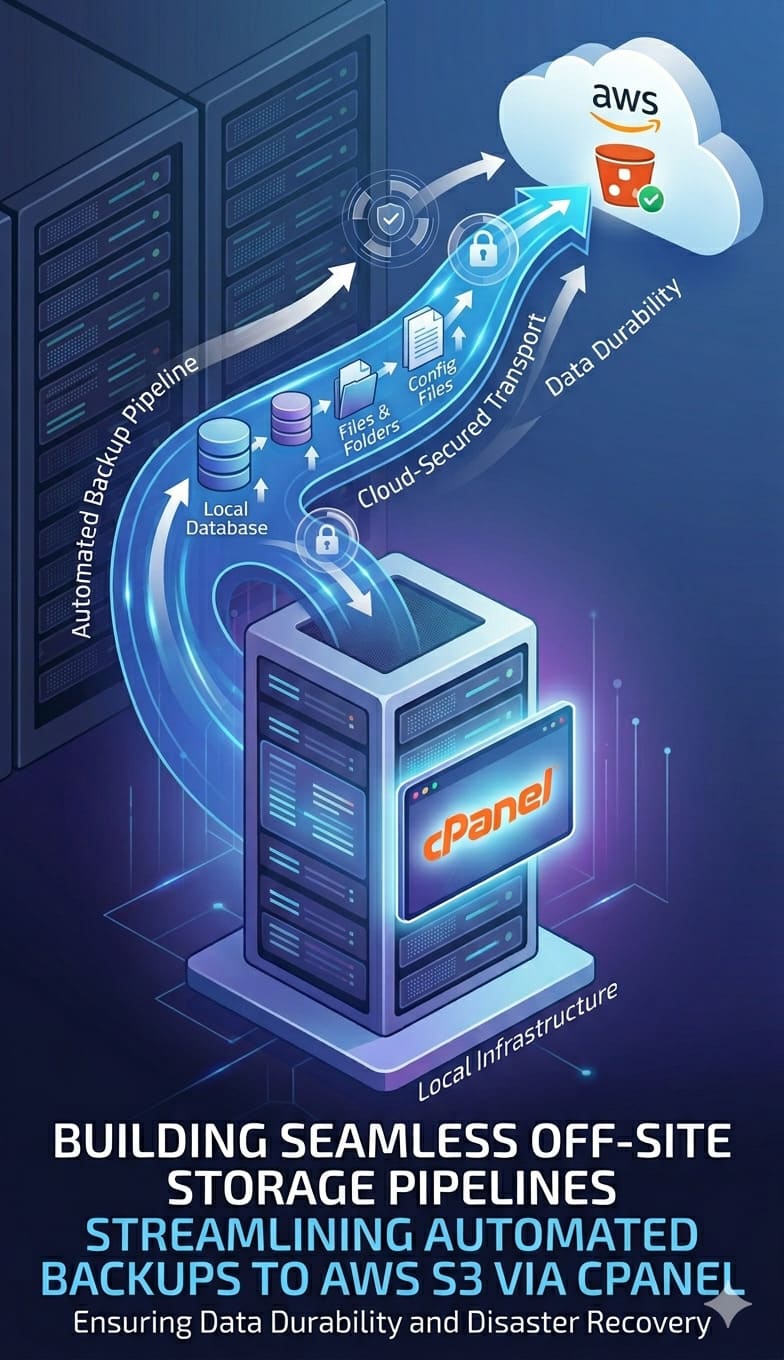
Building Seamless Off-Site Storage Pipelines: Streamlining Automated Backups to AWS S3 via cPanel
Why Modern Hosting Infrastructure Requires Off-Site Backup Pipelines Modern hosting infrastructure is constantly exposed to…
May 23, 2026
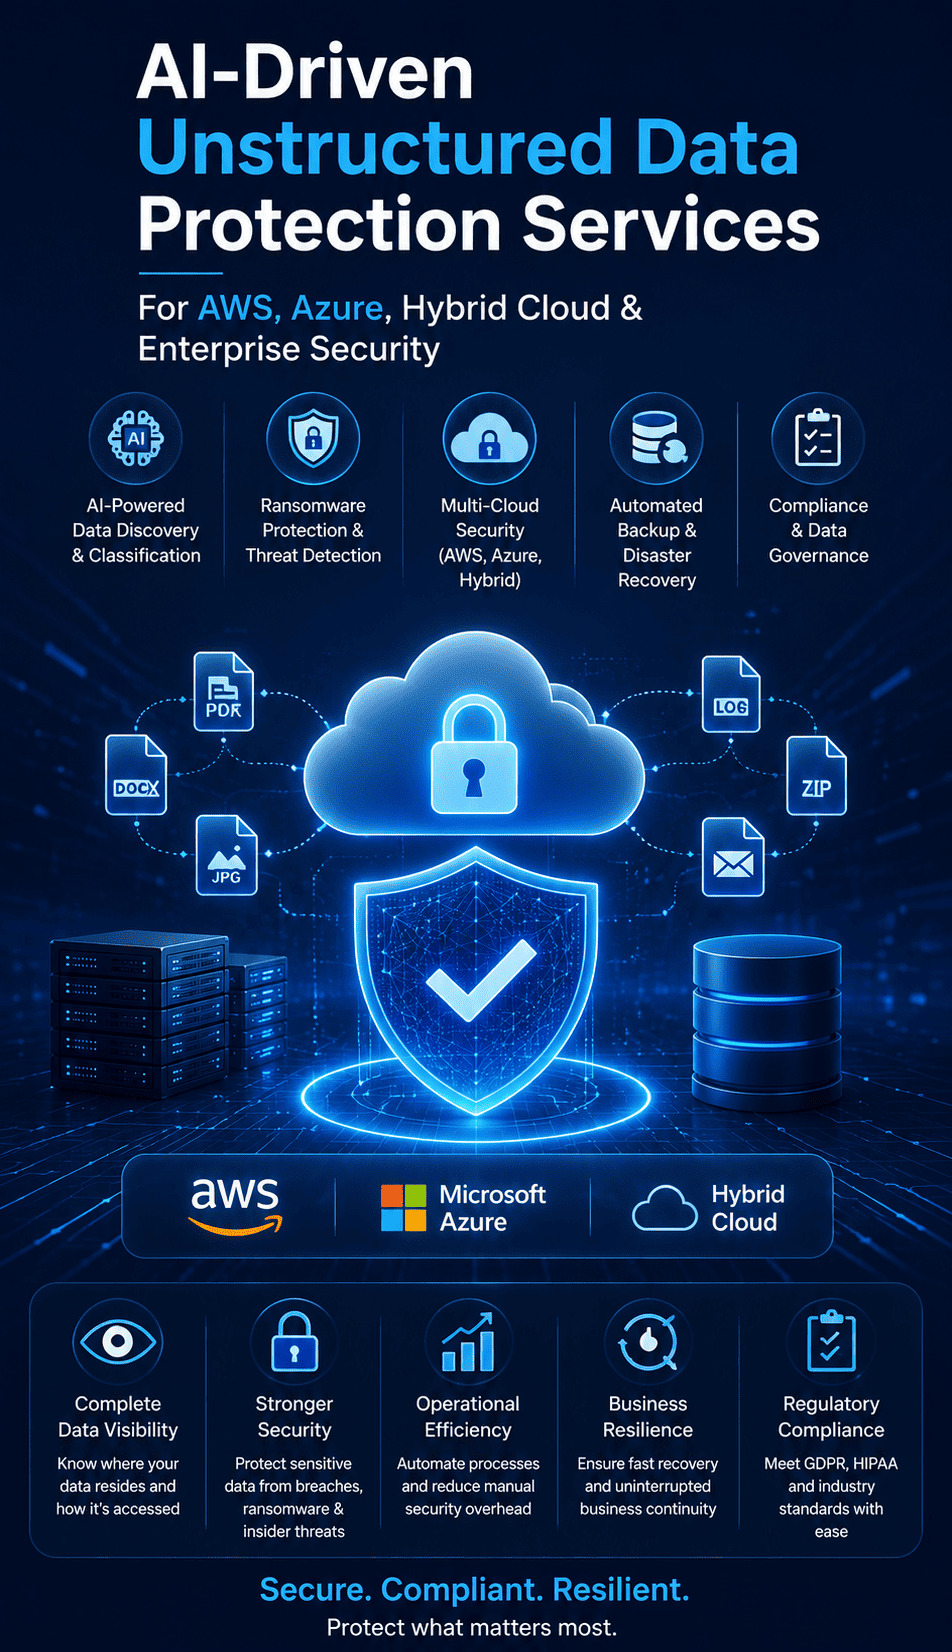
AI-Driven Unstructured Data Protection Services for AWS, Azure, Hybrid Cloud & Enterprise Security
Summary: Cloud Data Protection at a Glance: In modern enterprise architectures, up to 90% of…
May 18, 2026
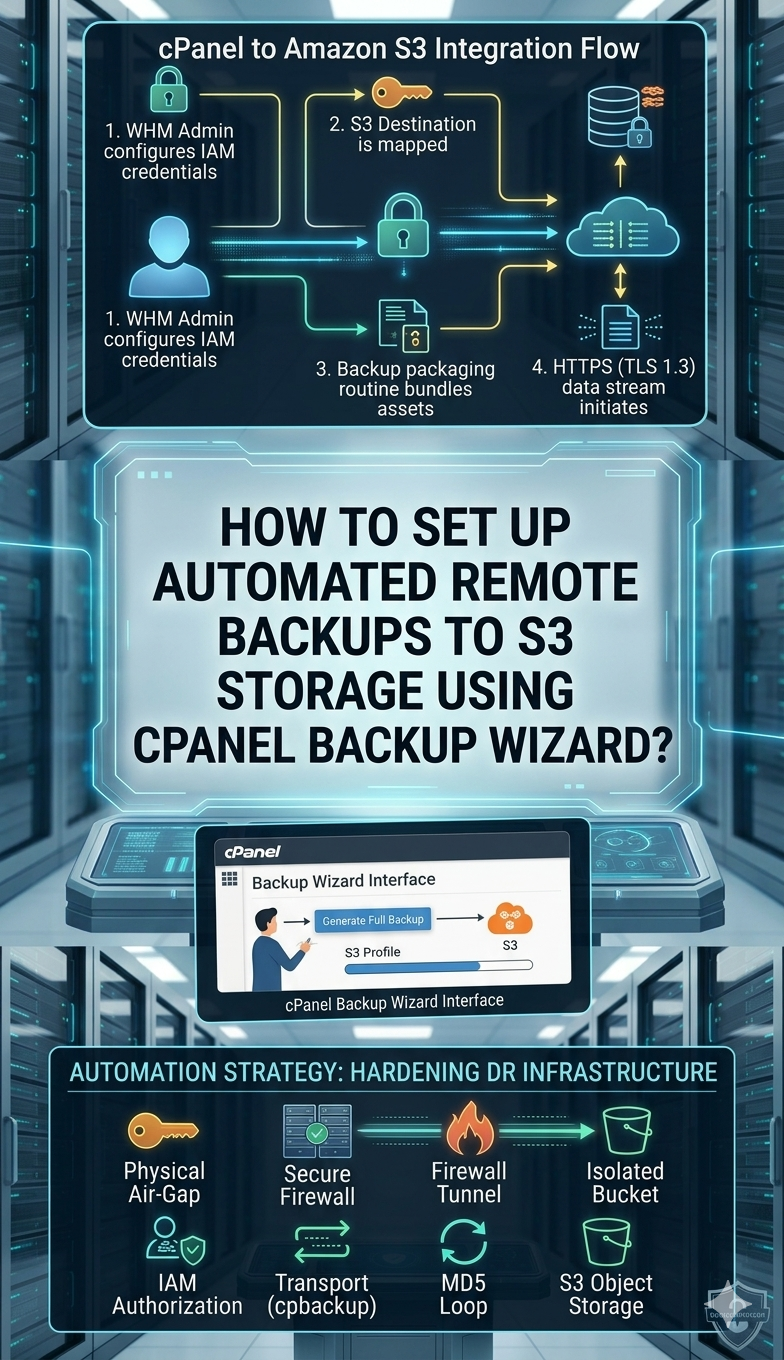
How to Set Up Automated Remote Backups to S3 Storage Using cPanel Backup Wizard
Summary Setting up automated off-site data pipelines is critical for safeguarding hosting environments against hardware…
May 7, 2026
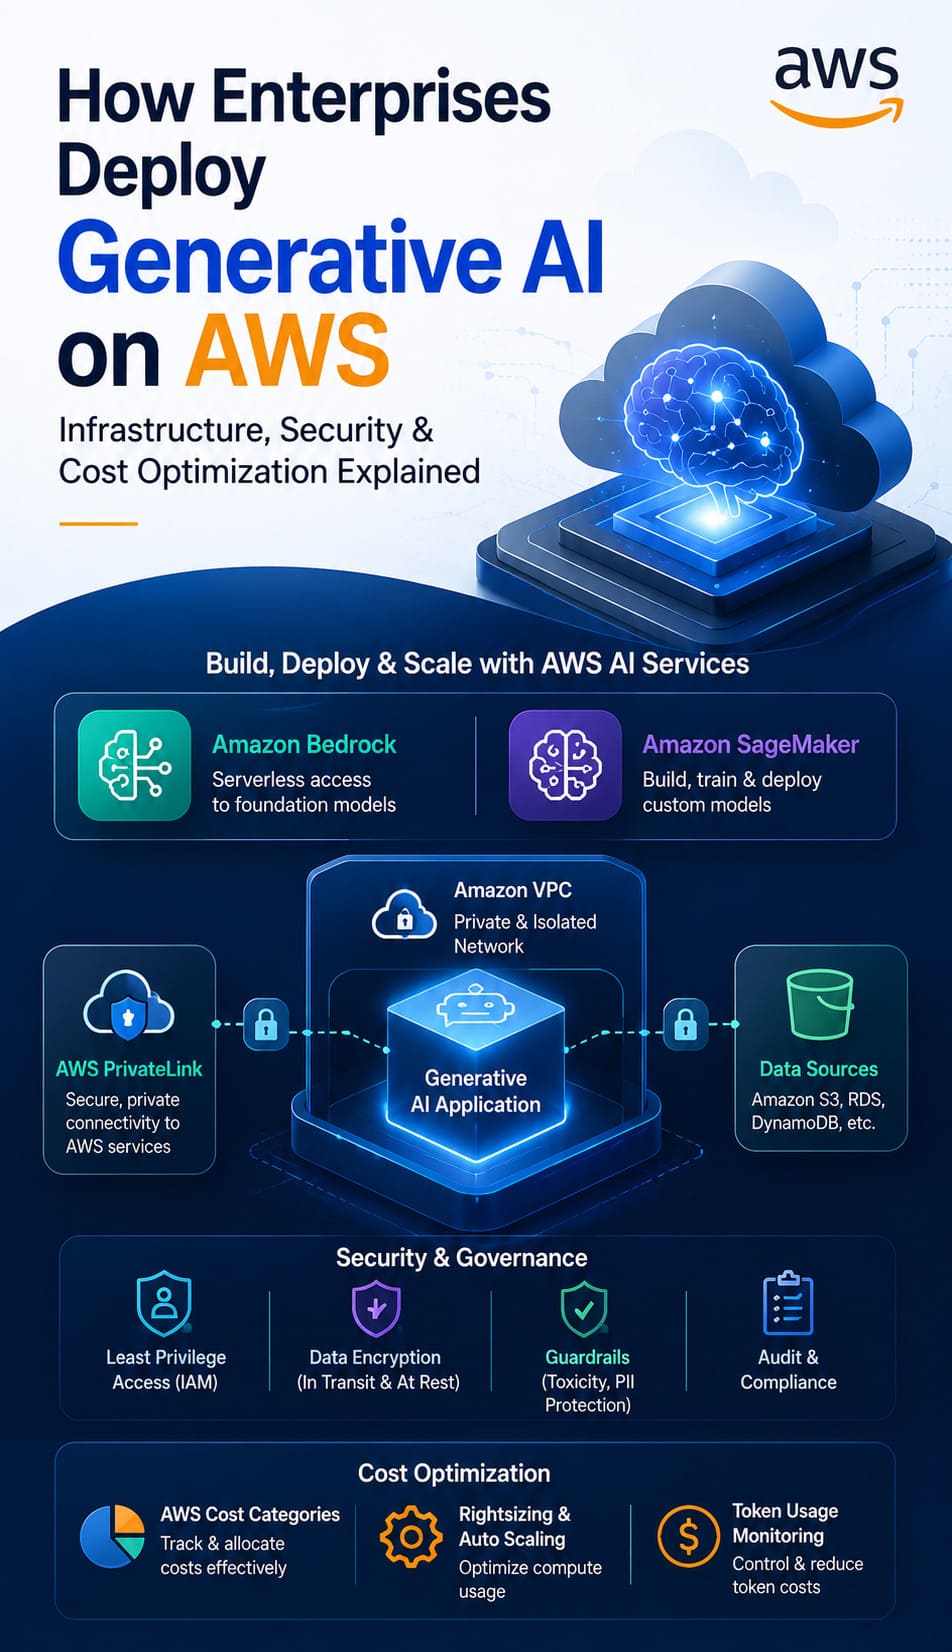
How Enterprises Deploy Generative AI on AWS: Infrastructure, Security & Cost Optimization Explained
Generative AI Overload + Skyrocketing AWS Bills + Data Leak Risks: The Enterprise Blueprint for…

April 28, 2026
Your VPN Is the Unlocked Back Door Hackers Are Walking Through Right Now
Overview For a long time, VPNs were treated like the gold standard of remote access.…

April 20, 2026
AI Pentesting for Business: How to Catch Security Gaps Before Hackers Use AI?
Key Takeaways: AI pentesting for business uses autonomous, agentic models to simulate real-world cyberattacks and…

April 20, 2026
Google Drive Ransomware Protection: Why Your Cloud Files are Still at Risk?
Quick Breakdown: Google Drive Ransomware Protection Analysis Google Drive is vulnerable to automated ransomware because…


