
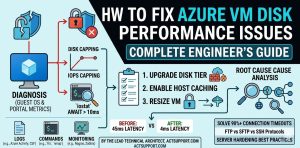
To fix Azure VM disk performance issues, engineers must align the virtual machine size with the correct Managed Disk tier while monitoring for IOPS and throughput capping. High latency typically occurs when a workload exceeds the provisioned limits of the disk or the VM’s underlying I/O bus. Resolving these cloud infrastructure issues involves enabling Host Caching, upgrading to Premium SSD or Ultra Disks, and utilizing the Azure Monitor agent to identify disk bursting bottlenecks.
Understanding Azure VM Storage Architecture
Azure storage utilizes a multi-layered architecture where disk performance depends on both the disk type and the VM series. Each virtual machine has a specific throughput and IOPS limit that acts independently of the disk’s own limits. If you attach a high-performance Premium SSD to a basic A-series VM, the VM will bottleneck the disk. This relationship creates a performance ceiling that infrastructure engineers must calculate during the initial design phase.
Why Azure VM Disk Performance Issues Happen
The primary cause of storage slowdowns in the cloud is “capping,” which occurs when the demand exceeds provisioned limits. Azure enforces strict limits on Input/Output Operations Per Second (IOPS) and Throughput (MBps) at both the disk and VM levels. When a database or application pushes more data than the tier allows, Azure throttles the requests. This leads to increased disk queue depth and high application latency.
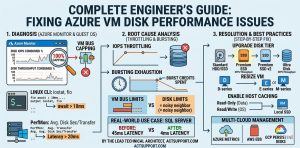
Root Causes of Disk Throttling
Throttling often happens because of “bursting” exhaustion. Many Azure disks allow for short-term performance spikes above their baseline. However, once the burst credits are spent, the disk reverts to its baseline speed. Engineers often see high performance for the first few minutes of a task, followed by a sudden drop. This behavior is a classic sign of an undersized disk tier for the specific workload.
How Engineers Diagnose Azure Storage Bottlenecks
Diagnosis begins with Azure Metrics Explorer within the Azure Portal. Engineers monitor the “Disk IOPS Consumed Percentage” and “Disk Throughput Consumed Percentage” metrics. If these values consistently hit 100%, the disk is being throttled. We also check the “VM Cached IOPS Consumed Percentage” to see if the bottleneck is at the VM level rather than the disk itself.
Using Guest OS Tools for Deep Analysis
Portal metrics only show part of the story, so we use Guest OS tools for real-time debugging. On Linux servers, the iostat command provides a granular view of device utilization and wait times. An await value higher than 10ms usually indicates a storage backend struggle. For Windows workloads, Performance Monitor (PerfMon) tracks “Disk Sec/Transfer,” which is the most accurate measure of latency at the OS level.
OPTIMIZE AZURE VM STORAGE PERFORMANCE
Is slow Azure disk performance causing application latency and downtime?
Disk throttling, IOPS capping, and incorrect VM sizing can severely impact production workloads. Our engineers help optimize Azure VM storage, Premium SSD configurations, caching, and proactive monitoring to ensure faster performance and stable cloud infrastructure.
Troubleshooting with Linux CLI Commands
Engineers often run iostat -xz 1 10 to observe disk utilization percentages. If the %util stays near 100% while throughput is low, the disk is likely experiencing a high number of small I/O requests. We also use fio (Flexible I/O Tester) to simulate production loads. This helps us verify if the underlying Azure storage is meeting the promised SLA before we blame the application.
# Example fio command to test random read/write performance
fio –name=random-ur –ioengine=libaio –rw=randrw –bs=4k –numjobs=4 –size=2G –iodepth=64 –runtime=60 –time_based –group_reporting
How to Fix Azure VM Disk Performance Step-by-Step
The first fix is usually changing the disk tier from Standard to Premium SSD v2 or Ultra Disk. This change happens in the Azure Portal without rebuilding the VM, though a reboot may be required for certain resizing operations. Upgrading the disk increases the baseline IOPS and throughput significantly. This action immediately alleviates pressure on high-traffic databases or web servers.
Optimizing Host Caching for Better Speed
Azure offers Read-only or Read/Write host caching for Premium SSDs. Read-only caching is highly effective for OS disks and SQL Server data files. It offloads I/O requests to the VM’s local SSD or memory. This reduces the number of calls made to the remote Azure Storage backend. Correct caching configuration can sometimes double the effective performance of a disk without increasing monthly costs.
Resizing the Virtual Machine for Higher I/O Bus Limits
If the disk is not hitting its 100% limit but latency persists, the VM itself may be the bottleneck. Every VM size has a “Max Uncached Disk Throughput” limit. Engineers must check the Azure documentation to ensure the VM size supports the disk’s potential. Upgrading a D-series VM to an E-series or M-series often provides the necessary I/O headroom for enterprise-grade workloads.
Implementation of Premium SSD v2 and Ultra Disks
For sub-millisecond latency, engineers deploy Ultra Disks. These disks allow you to scale IOPS and Throughput independently of disk capacity. This is a game-changer for high-performance computing (HPC) and massive transaction databases. Unlike standard tiers, Ultra Disk performance can be adjusted on the fly without any downtime or volume detachments.
Real-World Production Scenario: SQL Server Latency
A client reported slow query times on their SQL Server running on an Azure DSv2 VM. Initial logs showed “Log Write” waits in SQL Server. We checked Azure Metrics and found the Data Disk was hitting its throughput cap during peak hours. By upgrading the disk from a P30 to a P40 tier and enabling Read-only caching, we reduced disk latency from 45ms to 4ms.
Performance and Security Impact of Poor Disk Speed
Slow disk performance does more than just frustrate users. It can lead to data corruption if write buffers cannot flush in time. It also delays critical patch management tasks and system backups. From a security perspective, a slow disk can interfere with server hardening scripts and log shipping, leaving gaps in your audit trails.
Best Practices for Managed Disks in Azure
Engineers always use Managed Disks instead of older Unmanaged Disks for better reliability. We also suggest spreading data across multiple disks and using striped volumes (RAID 0) at the OS level. This combines the IOPS of multiple disks into a single logical volume. This is a standard practice in Azure cloud support for maximizing throughput on a budget.
Monitoring with Zabbix and Azure Monitor
A proactive approach involves integrating Azure Monitor with tools like Zabbix or Nagios. We set up alerts for when “Disk Queue Depth” exceeds a factor of 2 per disk spindlae. This gives the NOC services team early warning before users experience actual application slowness. Modern DevOps infrastructure relies on these automated triggers to maintain 99.9% uptime.
Comparing Azure Storage Tiers for Infrastructure Architects
Standard HDD is only for backup or infrequent access. Standard SSD works well for light web servers or dev environments. Premium SSD is the baseline for production enterprise apps. Premium SSD v2 and Ultra Disks are for the most demanding I/O workloads. Choosing the wrong tier is the most expensive mistake an architect can make in the cloud.
Impact of Outsourced Hosting Support on Performance
Utilizing outsourced hosting support or white label support ensures that experts are watching these metrics 24/7. These teams have seen hundreds of similar cloud infrastructure issues. They can identify a “noisy neighbor” effect or a storage cluster issue much faster than an internal team. This expertise is vital for maintaining high-performance server monitoring and maintenance.
Resolving Disk Issues in Multi-Cloud Environments
Infrastructure often spans across AWS server management and Google Cloud support. The disk performance metrics in Azure differ from AWS EBS or GCP Persistent Disks. Engineers must understand that Azure focuses heavily on VM-level capping. Managing these nuances requires a unified NOC services strategy to ensure consistent user experiences across all cloud providers.
One Real-World Case Study: Web App Recovery
A major retailer’s web app failed during a flash sale due to disk I/O exhaustion on their session state server. The local SSD was overwhelmed by temp files. We redirected the temp path to a new Premium SSD with Host Caching enabled. This move stabilized the site in under ten minutes. The fix prevented further revenue loss during the busiest hour of their year.
FAQ: Azure VM Disk Troubleshooting
What causes high disk latency on Azure VMs?
High latency is usually caused by the workload exceeding the IOPS or throughput limits of either the Managed Disk or the VM size itself.
How do engineers fix disk throttling in Azure?
Engineers fix throttling by upgrading the disk tier, resizing the virtual machine, or enabling Host Caching to offload I/O requests.
How can I check if my Azure disk is being throttled?
Use Azure Metrics Explorer to view the “Disk IOPS Consumed Percentage” metric. If it hits 100%, the disk is being throttled.
Is Premium SSD always better than Standard SSD?
For production workloads, yes. Premium SSD offers higher IOPS, better throughput, and much lower latency compared to Standard tiers.
Can I change Azure disk types without losing data?
Yes, you can change Managed Disk types (e.g., from Standard to Premium) in the Azure Portal with minimal downtime.
Conclusion: Achieving Peak Azure Performance
Fixing Azure VM disk issues requires a deep understanding of the relationship between compute and storage. By identifying bottlenecks through metrics and OS tools, you can implement the right tier and caching strategy. Proactive monitoring and adherence to best practices ensure that your cloud infrastructure issues are resolved before they impact users. A well-optimized storage layer is the foundation of a resilient and scalable cloud environment.
Related Posts
May 28, 2026
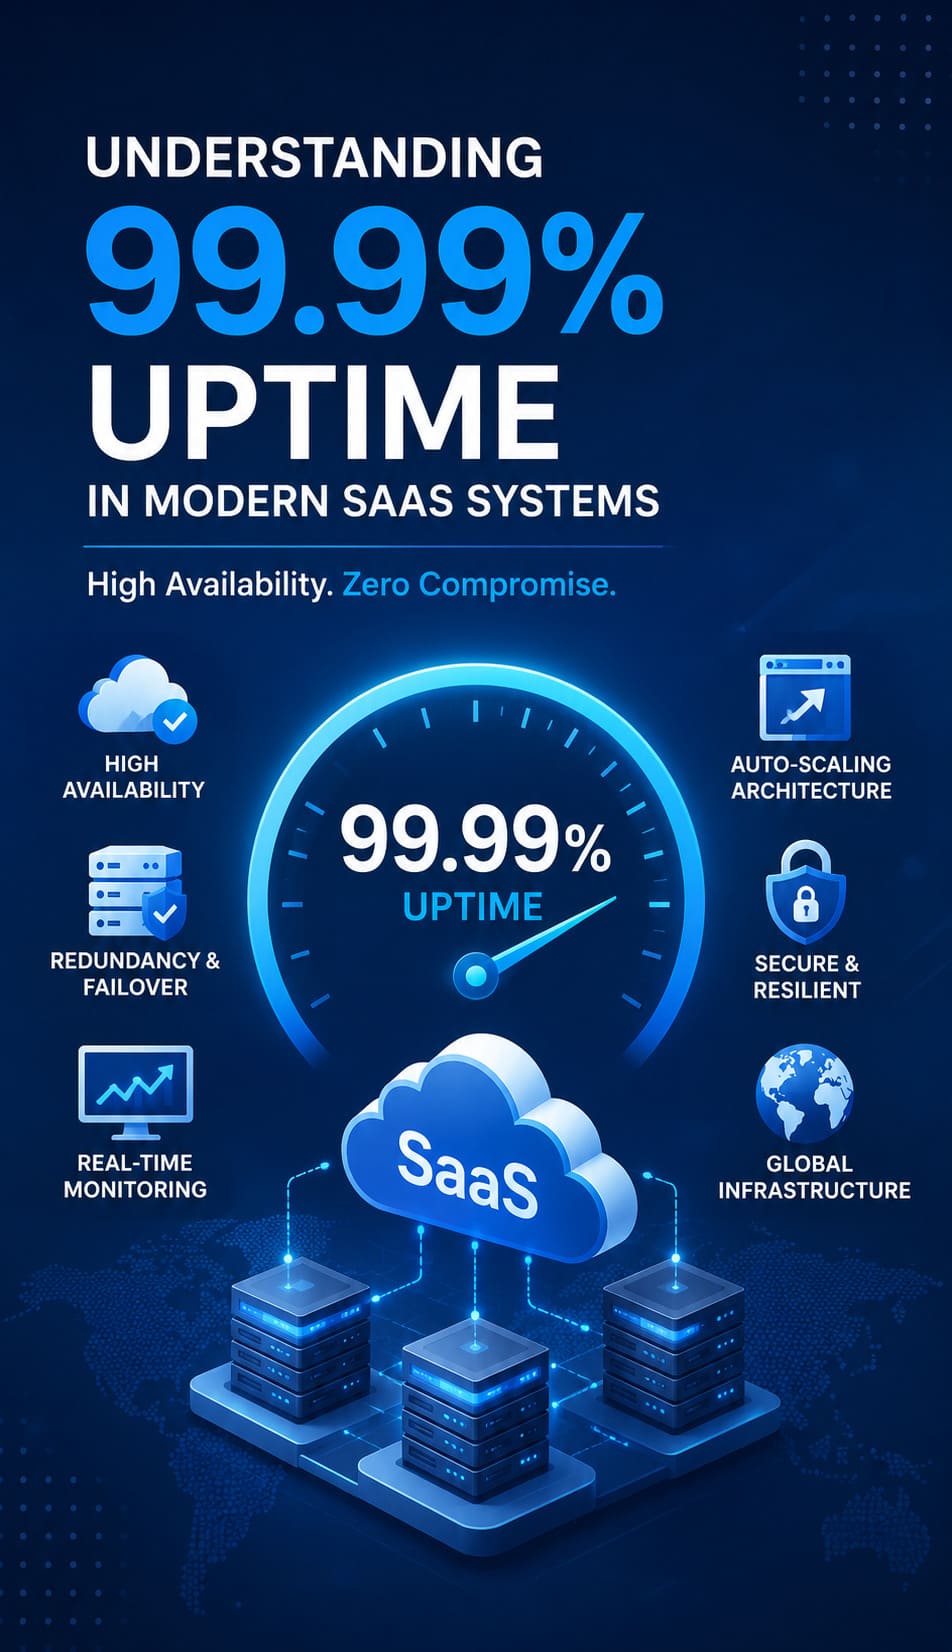
Understanding 99.99% Uptime in Modern SaaS Systems
Business-Critical Importance of High Availability In modern SaaS ecosystems, uptime is not just a technical…
May 27, 2026
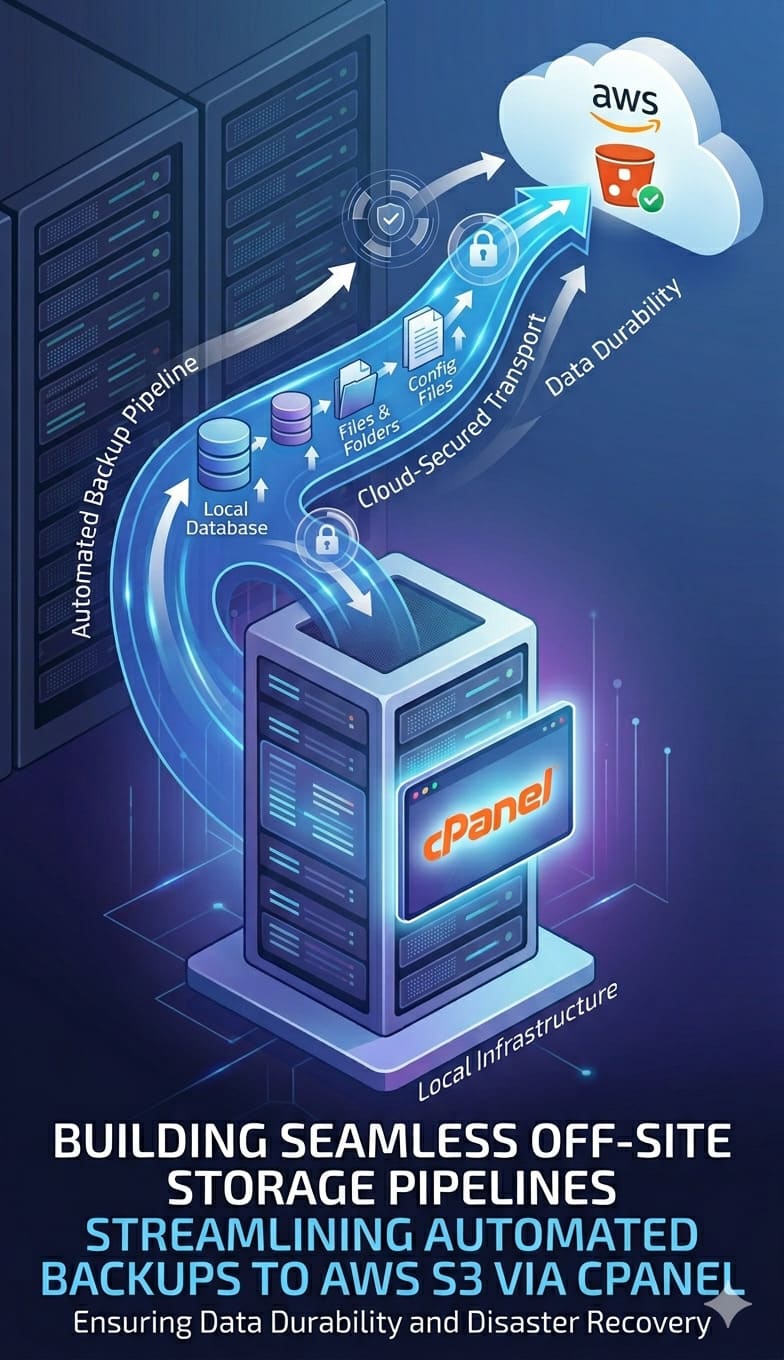
Building Seamless Off-Site Storage Pipelines: Streamlining Automated Backups to AWS S3 via cPanel
Why Modern Hosting Infrastructure Requires Off-Site Backup Pipelines Modern hosting infrastructure is constantly exposed to…
May 23, 2026
AI-Driven Unstructured Data Protection Services for AWS, Azure, Hybrid Cloud & Enterprise Security
Summary: Cloud Data Protection at a Glance: In modern enterprise architectures, up to 90% of…
May 18, 2026
How to Set Up Automated Remote Backups to S3 Storage Using cPanel Backup Wizard
Summary Setting up automated off-site data pipelines is critical for safeguarding hosting environments against hardware…
May 7, 2026
How Enterprises Deploy Generative AI on AWS: Infrastructure, Security & Cost Optimization Explained
Generative AI Overload + Skyrocketing AWS Bills + Data Leak Risks: The Enterprise Blueprint for…

April 28, 2026
Your VPN Is the Unlocked Back Door Hackers Are Walking Through Right Now
Overview For a long time, VPNs were treated like the gold standard of remote access.…

April 20, 2026
AI Pentesting for Business: How to Catch Security Gaps Before Hackers Use AI?
Key Takeaways: AI pentesting for business uses autonomous, agentic models to simulate real-world cyberattacks and…

April 20, 2026
Google Drive Ransomware Protection: Why Your Cloud Files are Still at Risk?
Quick Breakdown: Google Drive Ransomware Protection Analysis Google Drive is vulnerable to automated ransomware because…


