
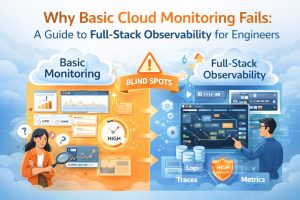
Why Basic Cloud Monitoring Fails: The Complete Guide to Full-Stack Observability for Engineers
Basic cloud monitoring fails because it only tracks high-level metrics like CPU and RAM, whereas full-stack observability provides the deep, contextual data needed to resolve complex distributed system failures. This matters because monitoring tells you that a system is down, but observability explains why it happened by correlating logs, metrics, and traces across the entire infrastructure. This guide solves the problem of “blind spots” in modern environments by providing an engineering-level framework for implementing full-stack visibility. By shifting from reactive monitoring to proactive observability, engineers can diagnose root causes in seconds rather than hours, ensuring peak performance for managed cloud support ecosystems.
The Mechanical Reality of Cloud Observability
Full-stack observability has evolved from traditional server monitoring into a complete data-driven discipline. It gives engineers deeper visibility into modern cloud infrastructure. Monitoring focuses on “known unknowns,” such as predefined dashboards for disk space or bandwidth. Observability, however, goes further. It analyzes system behavior using the data generated across the infrastructure.
For a senior infrastructure engineer, this means moving beyond basic alerts from tools like Zabbix or Nagios. Instead, every request is tracked end-to-end. It flows from the load balancer through microservices and finally to the database. This level of visibility provides clear insights into system behavior.
This deep technical clarity is critical for Linux server management services. Even a small bottleneck in a kernel parameter can trigger a global application timeout.
The core concept of observability rests on three pillars: metrics, logs, and traces. Metrics provide the numerical representation of data over time, logs offer the textual record of specific events, and traces follow the path of a single transaction across multiple services. When these three data types are integrated into a single pane of glass, engineers gain the ability to ask arbitrary questions about their infrastructure. Instead of seeing a generic “500 Internal Server Error,” an observant system reveals that a specific database query in the US-East-1 region is timing out because of a lock contention on a specific table. This transition from “is it up?” to “why is it slow?” is what separates basic monitoring from production-grade engineering.
Why Basic Monitoring Fails in Distributed Systems
The root cause of monitoring failure in modern cloud environments is the sheer complexity of ephemeral, containerized infrastructure. In a traditional setup, a server was a long-lived entity with a static IP; however, in a DevOps infrastructure management environment, servers (pods) may only exist for minutes. Basic monitoring tools often struggle with this “cardinality” problem, where they cannot track the unique IDs of thousands of short-lived containers. When a traffic spike occurs, a monitoring tool might show that the aggregate CPU is at 40%, which seems healthy, while in reality, 10% of your containers are in a “CrashLoopBackOff” state due to an unhandled exception.
Furthermore, traditional monitoring creates a “siloed” view of the stack. A network engineer might see clean pipes, a DBA might see low query latency, and a developer might see a “green” build, yet the end-user still experiences 5-second page loads. This happens because basic tools do not account for the “connective tissue” of the cloud the latency introduced by service meshes, API gateways, and DNS resolution. Without full-stack visibility, teams spend hours in “war rooms” pointing fingers at different layers of the stack because their individual dashboards are all green. This lack of context is a primary driver for organizations seeking outsourced hosting support to bridge the gap between simple alerts and actual resolution.
How Engineers Fix the Visibility Gap Step-by-Step
Engineers solve the visibility gap by first implementing “Standardized Instrumentation” across the entire application lifecycle. This involves moving away from proprietary agents and adopting open standards like OpenTelemetry. By instrumenting the code at the middleware level, we ensure that every outgoing HTTP request or database call automatically includes a “Trace ID.” This ID acts as a digital fingerprint, allowing us to stitch together the story of a request as it hops across different Linux servers and cloud services. We then configure our Linux server management services to forward system-level logs (like /var/log/syslog or /var/log/nginx/error.log) to a centralized log management system.
The second step involves “Contextual Alerting,” where we move away from static thresholds. Instead of alerting when “CPU > 80%,” which might be normal during a backup, we use “Service Level Objectives” (SLOs) based on the user experience. For example, we alert if the “99th percentile of latency exceeds 300ms for more than 5 minutes.” This engineering approach ensures that 24/7 NOC services only wake up for issues that actually impact the business. Finally, we correlate these alerts with “Change Events.” By integrating our CI/CD pipeline with our observability platform, we can instantly see if a latency spike correlates with a new code deployment or a configuration change in WHM server support.
GAIN FULL VISIBILITY INTO YOUR CLOUD INFRASTRUCTURE
Are hidden infrastructure blind spots slowing your applications and causing outages?
Basic monitoring only tells you that something failed. Our engineers help implement full-stack observability using metrics, logs, traces, Prometheus, Grafana, and proactive alerting systems to identify bottlenecks, reduce downtime, improve performance, and resolve production issues before they impact your users.
Real-World Production Scenarios: The Hidden Memory Leak
In a real-world production scenario, a Node.js application might start experiencing intermittent crashes every six hours. A basic monitoring tool like CloudWatch might show a sudden drop in traffic, but it won’t explain why. A senior engineer investigates this by looking at the “RSS Memory” metric alongside the “Garbage Collection” (GC) duration. By using a tool like Prometheus, they might notice that memory usage follows a “sawtooth” pattern steadily rising and never fully returning to the baseline after a GC cycle. This is a classic symptom of a memory leak in the application heap.
To diagnose this further, the engineer execs into the running container and uses Linux commands like top or ps -aux to confirm the memory consumption. They might then use a heap profiler to take a snapshot of the memory. By comparing two snapshots, they identify that a specific global variable is retaining references to old user sessions. The fix involves refactoring the session management logic and redeploying the service via the DevOps infrastructure management pipeline. Without full-stack observability, this issue would likely be “fixed” by simply rebooting the server, only for the crash to happen again six hours later, leading to inconsistent uptime and frustrated customers.
Mastering Tools, Logs, and Configuration Snippets
Expert-level observability requires a mastery of both cloud-native and open-source tools. For server monitoring and maintenance, we often deploy a combination of Prometheus for metrics and Grafana for visualization. For example, a Prometheus configuration snippet might look like this:
YAML
scrape_configs:
  - job_name: 'node_exporter'
    static_configs:
      - targets: ['localhost:9100']
This simple config allows us to pull hundreds of hardware and OS metrics from a Linux server. When a server hardening protocol is implemented, we also monitor the /var/log/auth.log for unauthorized SSH attempts. Using a command like tail -f /var/log/auth.log | grep “Failed password”, an engineer can see brute-force attacks in real-time. In a managed cloud support environment, these logs are automatically parsed and sent to a SIEM (Security Information and Event Management) system. This level of technical depth ensures that we are not just watching the server, but actively defending it based on real-time data.
Performance and Security Impact of Observability
Full-stack observability has a profound impact on both performance optimization and security posture. From a performance standpoint, having “Traces” allows engineers to identify “N+1 query” problems where an application makes a hundred database calls instead of one. By fixing these at the code level, we reduce the load on our AWS server management clusters, often allowing us to downsize instances and save 20-30% on monthly cloud costs. Observability turns “guessing” into “profiling,” allowing for surgical improvements in application throughput.
From a security perspective, observability is the foundation of modern “Threat Hunting.” While a firewall blocks known bad IPs, an observant system detects “Anomalous Egress Traffic.” If a web server suddenly starts sending 5GB of data to an unknown IP in a different country, an observability alert triggers immediately. This is far more effective than basic patch management alone. By correlating system call logs with network flow logs, 24/7 NOC services can identify a zero-day exploit in progress. This proactive stance is a core component of white label support, providing an invisible but impenetrable layer of security for the end customer.
Best Practices Used by Senior Infrastructure Teams
Senior teams follow the “Observability as Code” principle. Every time a new service is defined in Terraform or CloudFormation, the corresponding dashboards and alerts are created automatically. This ensures that no “Dark Infrastructure” exists every resource is monitored from the second it is provisioned. We also practice “Tagging Consistency,” ensuring that every log and metric carries metadata like env:production, service:api, and version:v1.2. This allows for instant filtering during a high-pressure outage, saving precious minutes of Mean Time to Recovery (MTTR).
Another best practice is the “Dashboard Hygiene” rule. We avoid “Dashboard Sprawl” by creating a single “Executive Summary” dashboard that links to deeper technical views. The top-level view shows the “Golden Signals”: Latency, Traffic, Errors, and Saturation. If the “Errors” sparkline turns red, an engineer can click it to jump directly to the relevant logs and traces for that specific timeframe. This streamlined workflow is why professional managed cloud support is significantly more effective than fragmented, in-house efforts that rely on dozens of disconnected tools.
Comparison: Monitoring vs. Observability in 2026
To clarify the distinction, consider the task of managing a cPanel server management environment. Monitoring tells you “The disk is 90% full.” This is a useful alert, but it is reactive. Observability tells you “The disk is filling up at a rate of 1GB per hour, and 80% of that growth is coming from a specific user’s error log which is exploding because of a failed database connection.” The latter provides the “Why” and the “How” in a single view. Monitoring is about the symptoms; observability is about the systemic health and underlying causes.
| Feature | Basic Monitoring | Full-Stack Observability |
|---|---|---|
| Focus | Health of individual components | Health of the entire system/user journey |
| Data Type | Primarily Metrics (CPU, RAM) | Metrics, Logs, and Distributed Traces |
| Approach | Reactive (Alerts on failures) | Proactive (Identifies trends/patterns) |
| Complexity | Best for monolithic, static setups | Mandatory for microservices and cloud-native |
| Resolution | Tells you something is wrong | Tells you exactly what is wrong and why |
Case Study: Solving the “Ghost” Latency Spike
A fintech client experienced a “ghost” latency spike every Tuesday at 10:00 AM, causing their mobile app to hang for 30 seconds. Their internal team’s basic cloud monitoring showed no CPU or memory issues on the application servers. When our 24/7 NOC services took over, we implemented full-stack observability. By looking at “Distributed Traces,” we discovered that at 10:00 AM, a scheduled reporting job on a completely different VPC was saturating the shared NAT Gateway.
lass=”yoast-text-mark” />>The application servers were healthy, but they couldn’t communicate with the external payment gateway because the network path was choked by the background reporting job. We diagnosed this by correlating “Network Retransmission” metrics with the “Trace Latency” of the payment API calls. We fixed the issue by moving the reporting job to a private endpoint and implementing a dedicated NAT Gateway for production traffic. The total time to resolution was 45 minutes once the data was visible. This case study proves that without full-stack visibility, you are effectively flying blind in the cloud.
Quick Summary
Full-stack observability is the engineering practice of correlating metrics, logs, and traces to provide a complete view of system health. Unlike basic monitoring, which only flags failures, observability allows engineers to diagnose the root cause of complex issues like memory leaks, network bottlenecks, and “ghost” latency. By implementing tools like Prometheus and OpenTelemetry, and focusing on Service Level Objectives (SLOs), managed cloud support teams can ensure 99.99% uptime. This proactive approach reduces cloud costs, enhances security, and ensures that DevOps infrastructure management remains agile and resilient against unpredictable traffic patterns.
Conclusion: The Engineering Path to Total Visibility
In the digital-first era, your infrastructure is only as strong as your ability to see inside it. Moving from basic monitoring to full-stack observability is not just a tool upgrade; it is a fundamental shift in the engineering mindset. It replaces the “check-box” security and health-check culture with a rigorous, data-driven approach to system resilience. By embracing the pillars of metrics, logs, and traces, you ensure that your cloud environment is not just “running,” but performing at its absolute peak.
Ultimately, observability provides the peace of mind needed to innovate at scale. When you know you can diagnose and fix any issue in minutes, you can deploy code faster and more frequently. Partnering with a provider of professional managed cloud support and Linux server management services gives you the elite-level visibility required to compete in 2026. Don’t settle for “up” when you can have “optimized.” Harden your visibility today and build a future on a foundation of total infrastructure clarity.
Related Posts
May 28, 2026
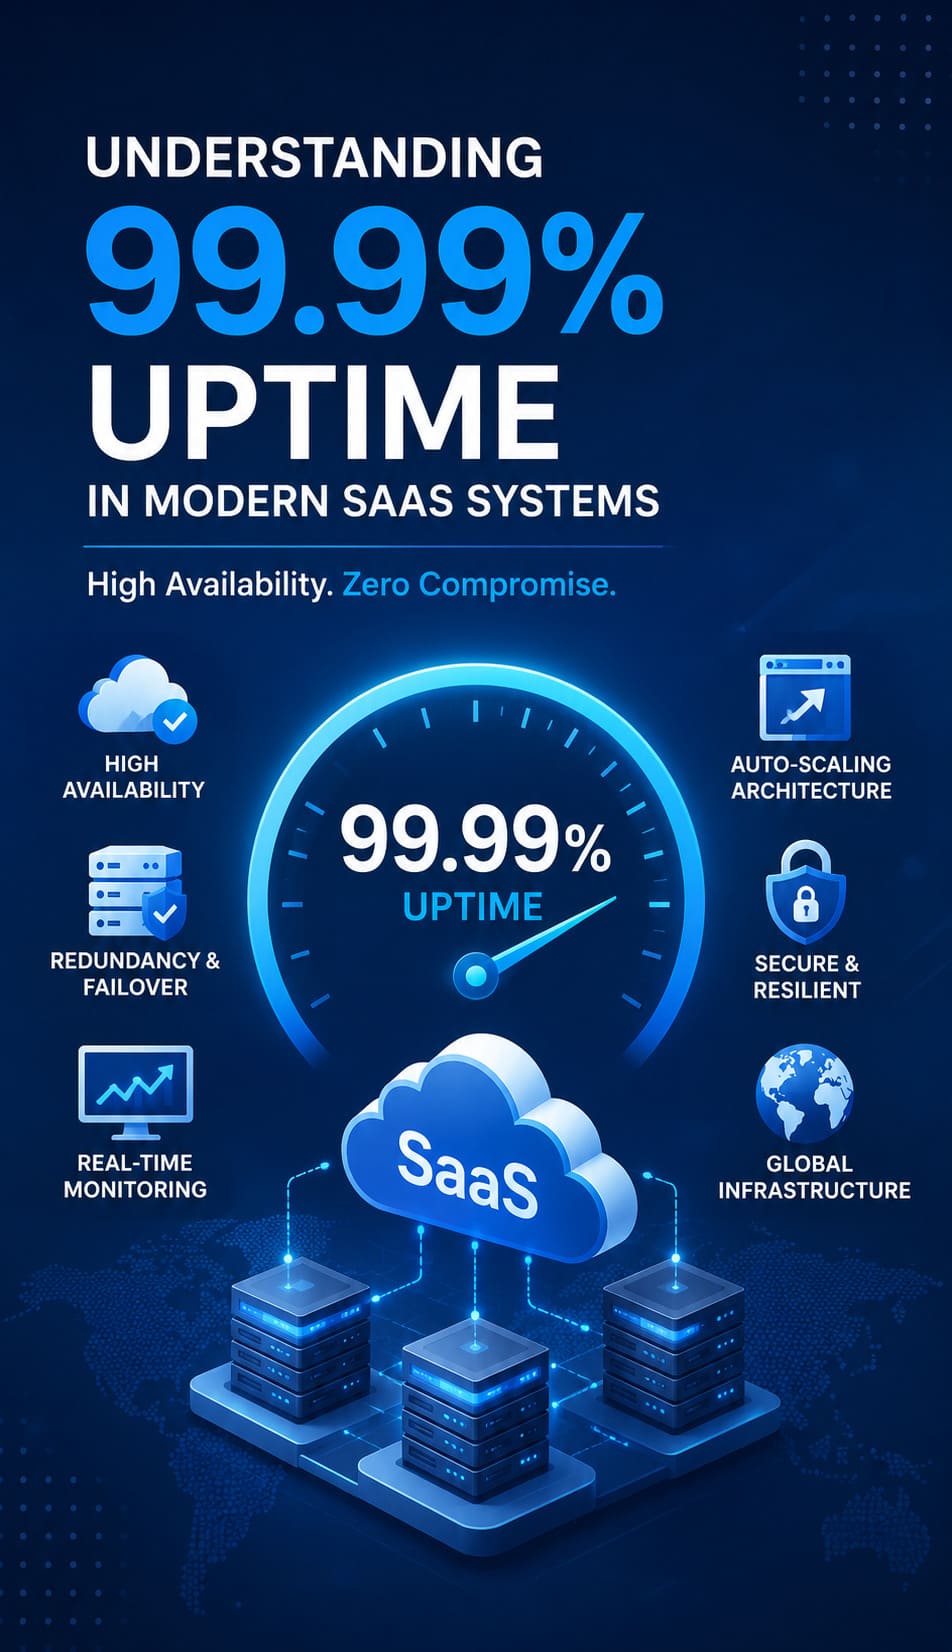
Understanding 99.99% Uptime in Modern SaaS Systems
Business-Critical Importance of High Availability In modern SaaS ecosystems, uptime is not just a technical…
May 27, 2026
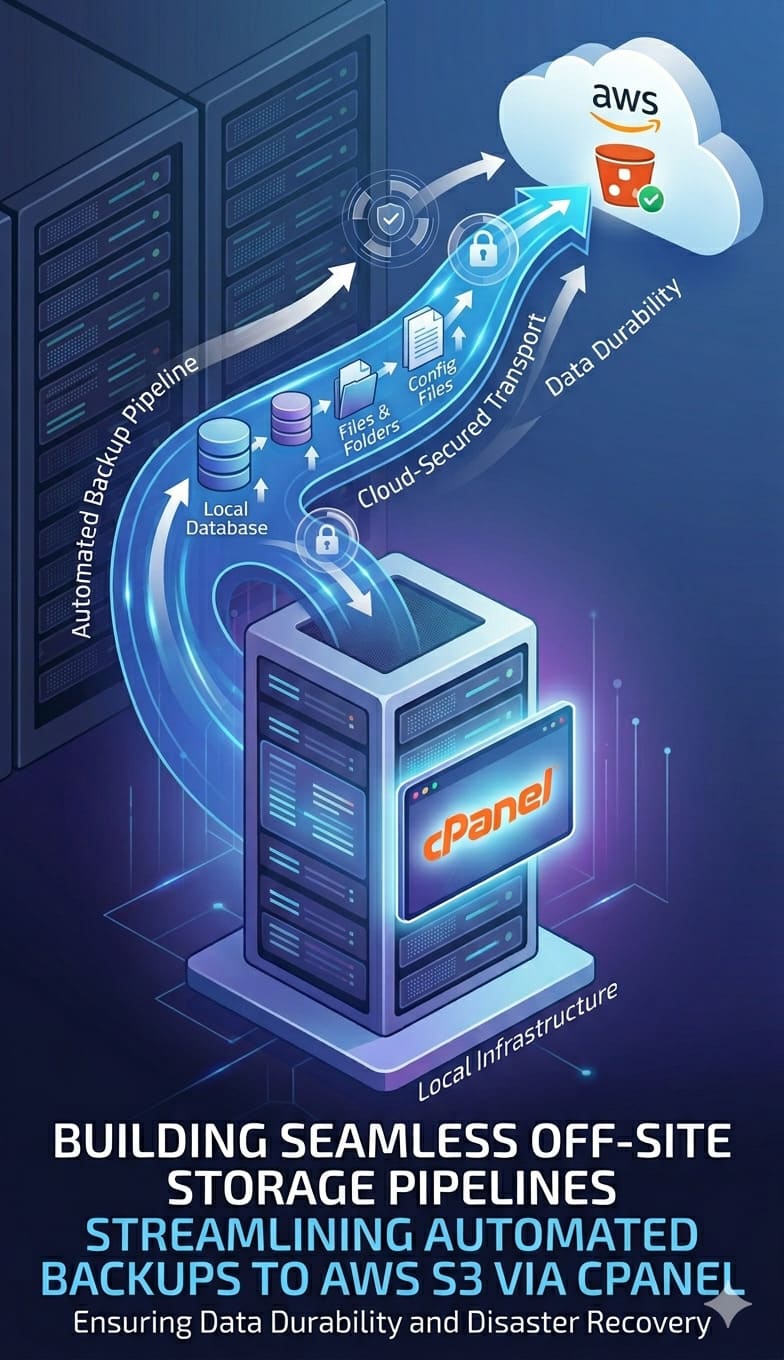
Building Seamless Off-Site Storage Pipelines: Streamlining Automated Backups to AWS S3 via cPanel
Why Modern Hosting Infrastructure Requires Off-Site Backup Pipelines Modern hosting infrastructure is constantly exposed to…
May 23, 2026
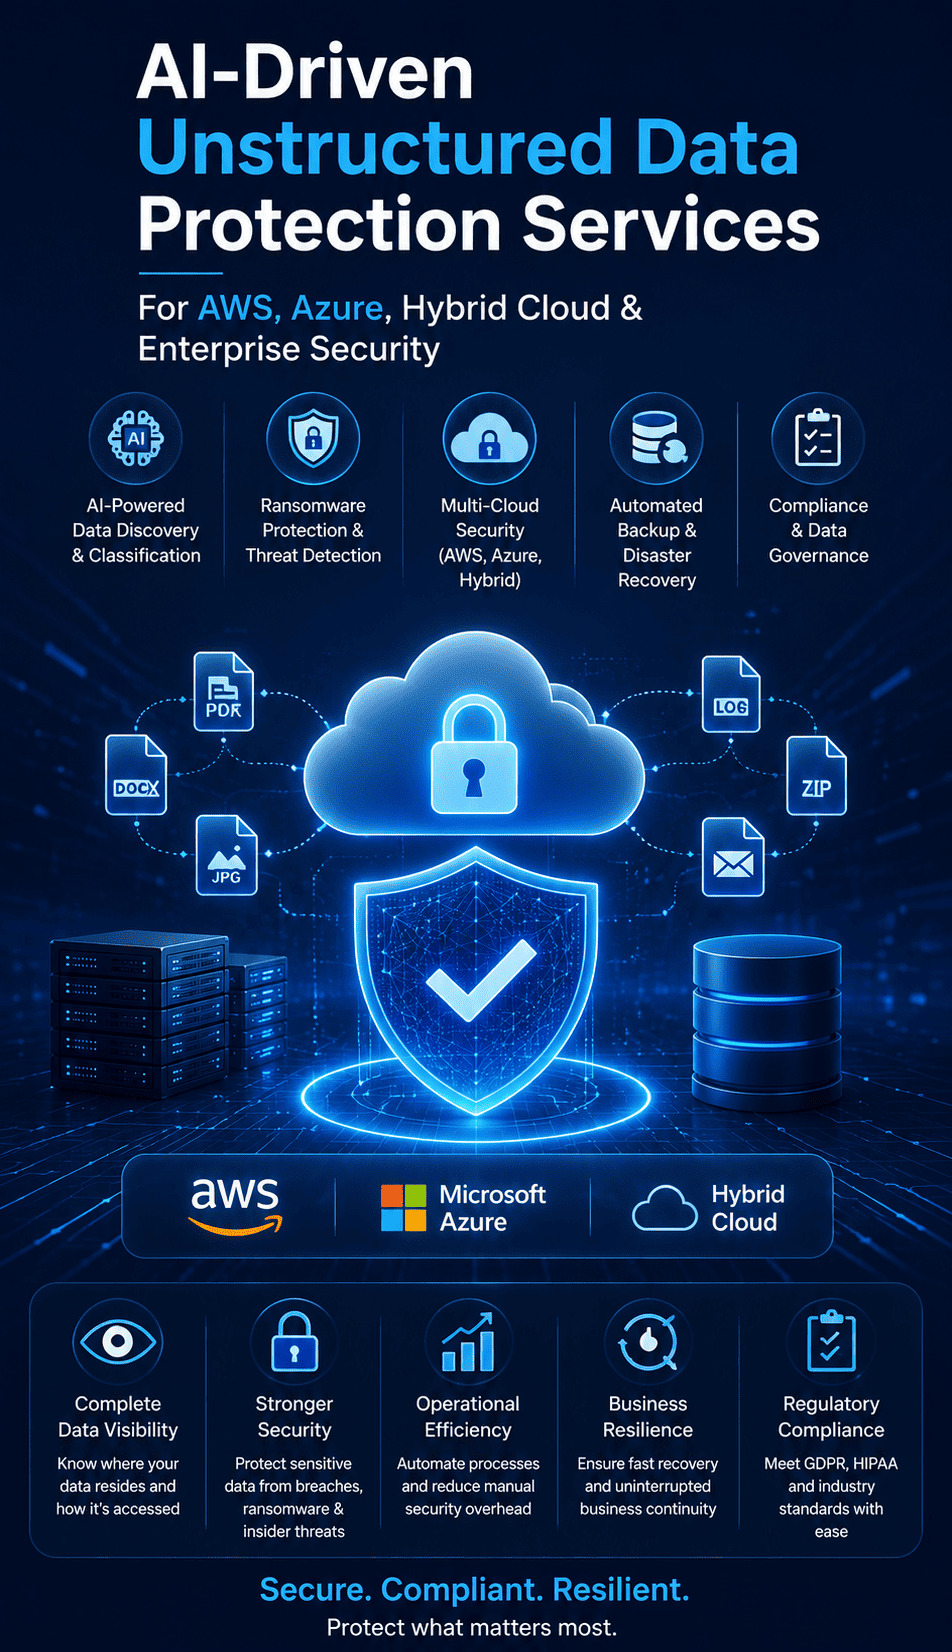
AI-Driven Unstructured Data Protection Services for AWS, Azure, Hybrid Cloud & Enterprise Security
Summary: Cloud Data Protection at a Glance: In modern enterprise architectures, up to 90% of…
May 18, 2026
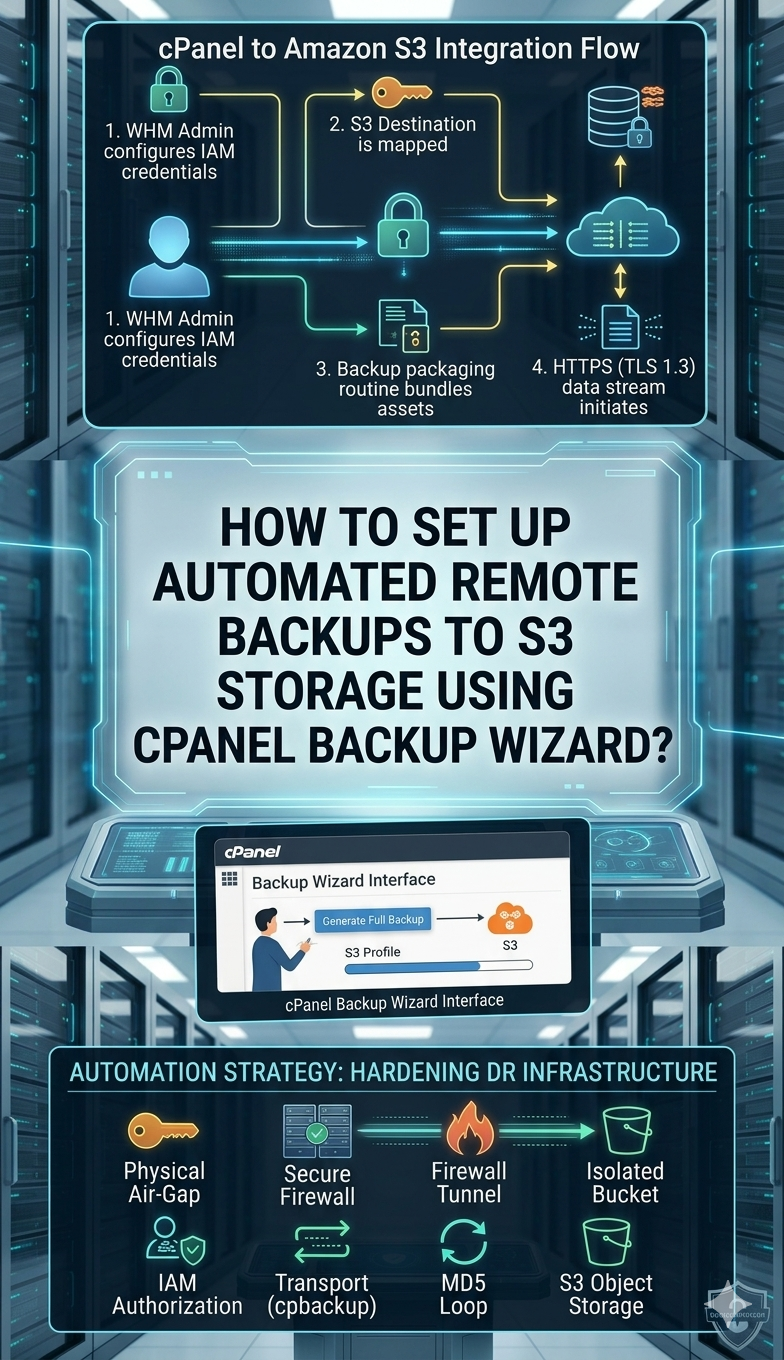
How to Set Up Automated Remote Backups to S3 Storage Using cPanel Backup Wizard
Summary Setting up automated off-site data pipelines is critical for safeguarding hosting environments against hardware…
May 7, 2026
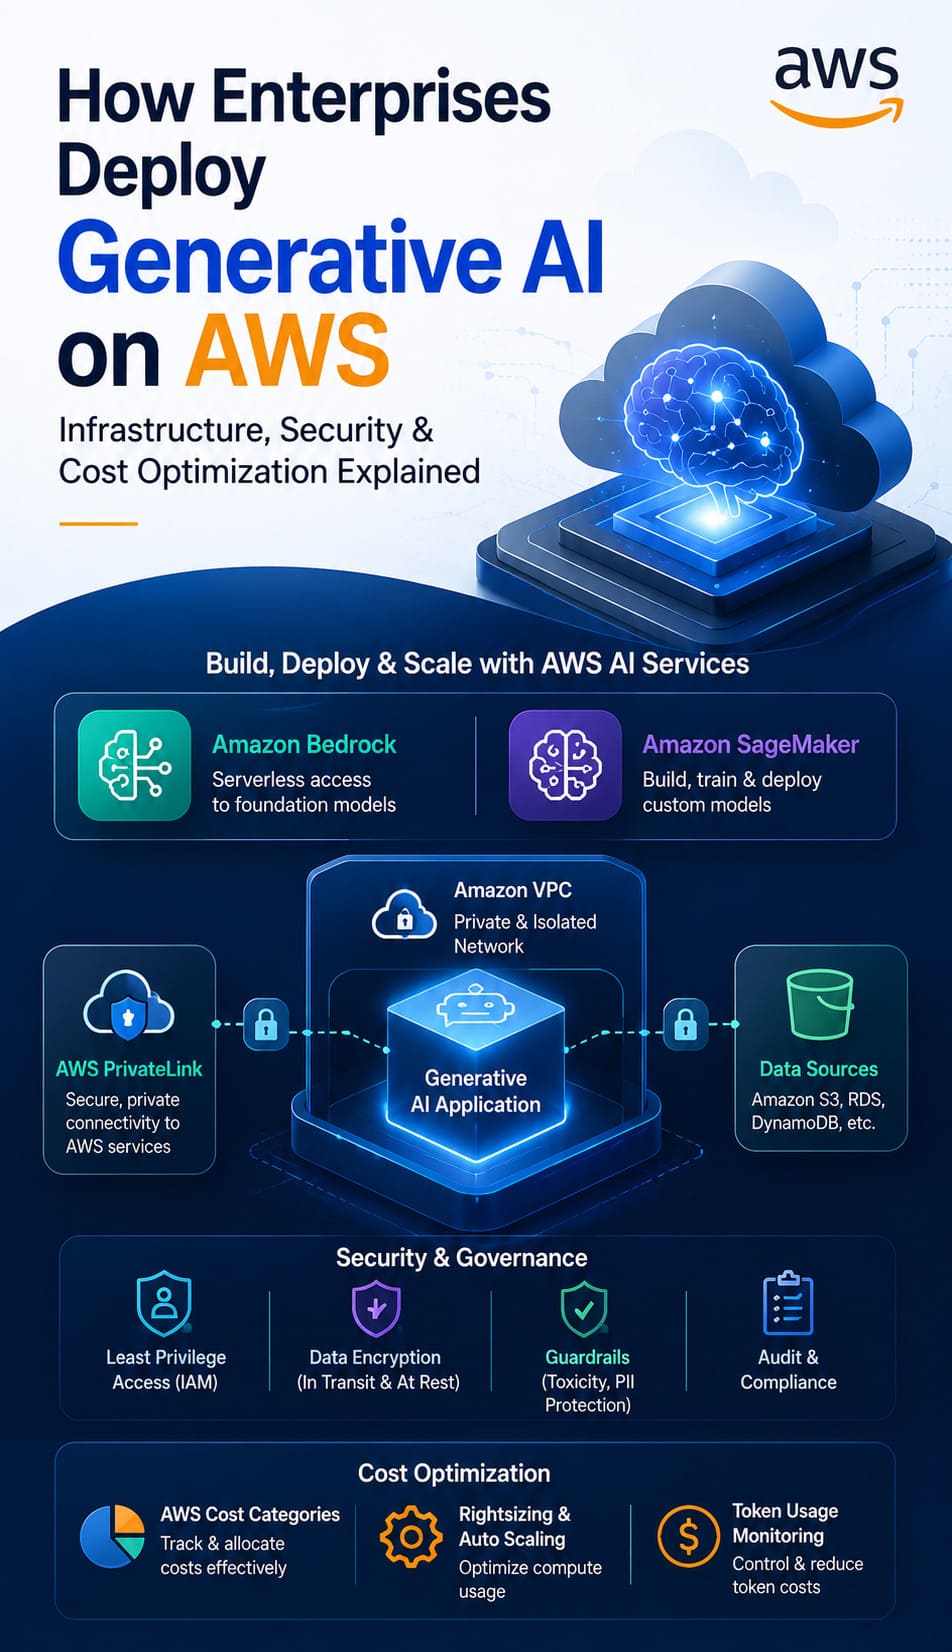
How Enterprises Deploy Generative AI on AWS: Infrastructure, Security & Cost Optimization Explained
Generative AI Overload + Skyrocketing AWS Bills + Data Leak Risks: The Enterprise Blueprint for…

April 28, 2026
Your VPN Is the Unlocked Back Door Hackers Are Walking Through Right Now
Overview For a long time, VPNs were treated like the gold standard of remote access.…

April 20, 2026
AI Pentesting for Business: How to Catch Security Gaps Before Hackers Use AI?
Key Takeaways: AI pentesting for business uses autonomous, agentic models to simulate real-world cyberattacks and…
April 20, 2026
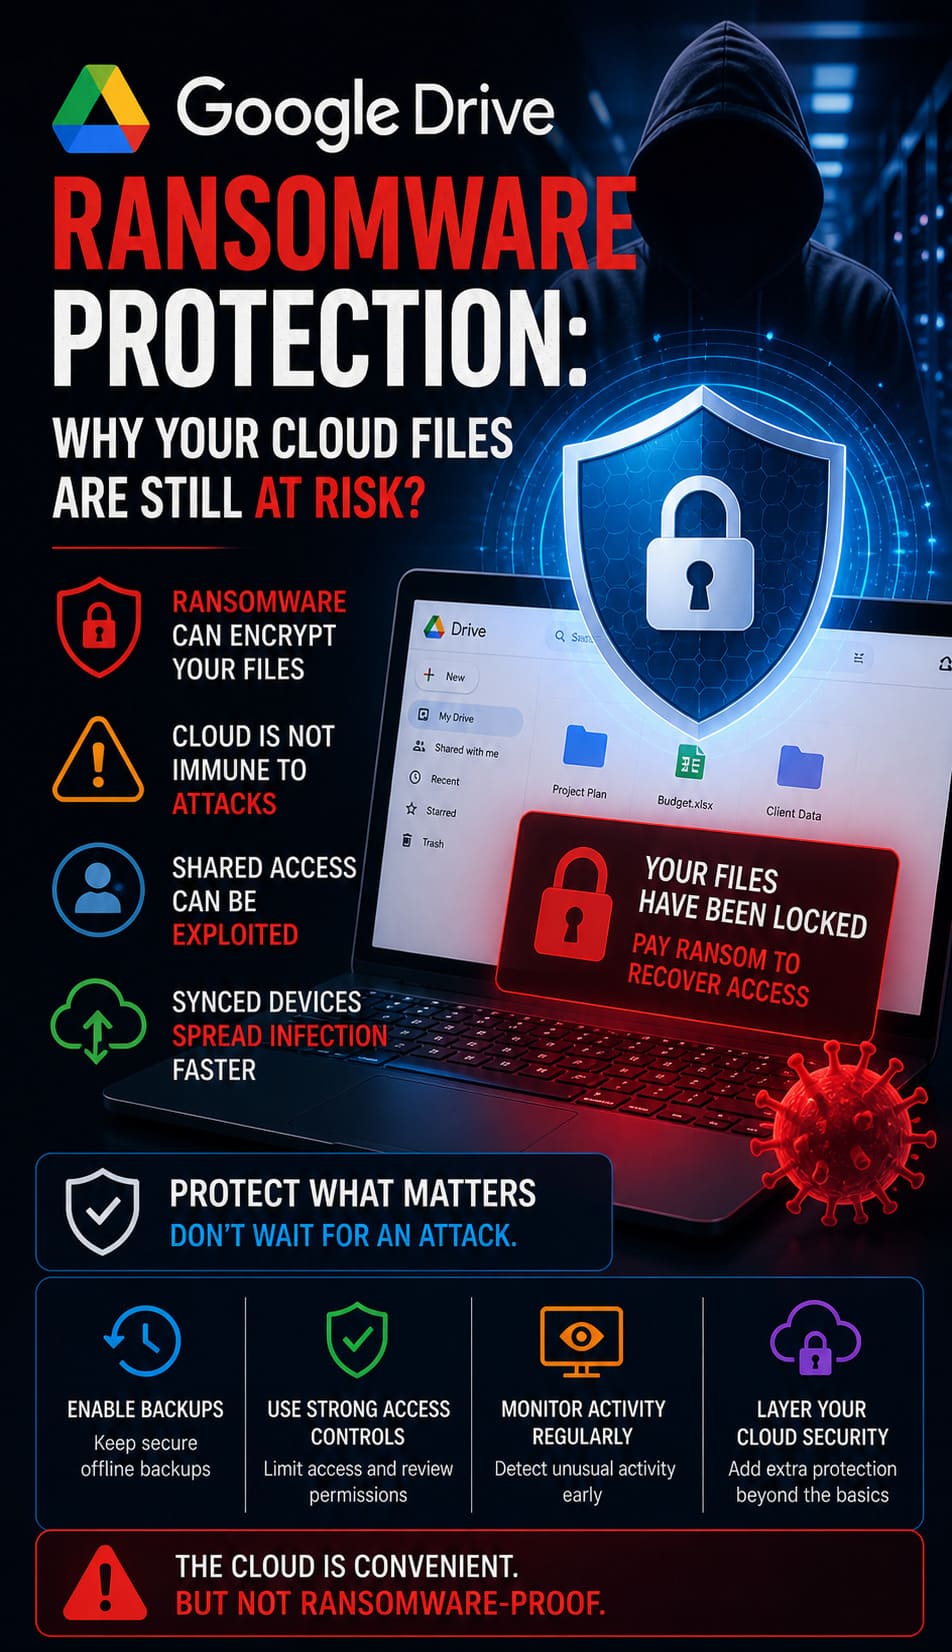
Google Drive Ransomware Protection: Why Your Cloud Files are Still at Risk?
Quick Breakdown: Google Drive Ransomware Protection Analysis Google Drive is vulnerable to automated ransomware because…
April 16, 2026
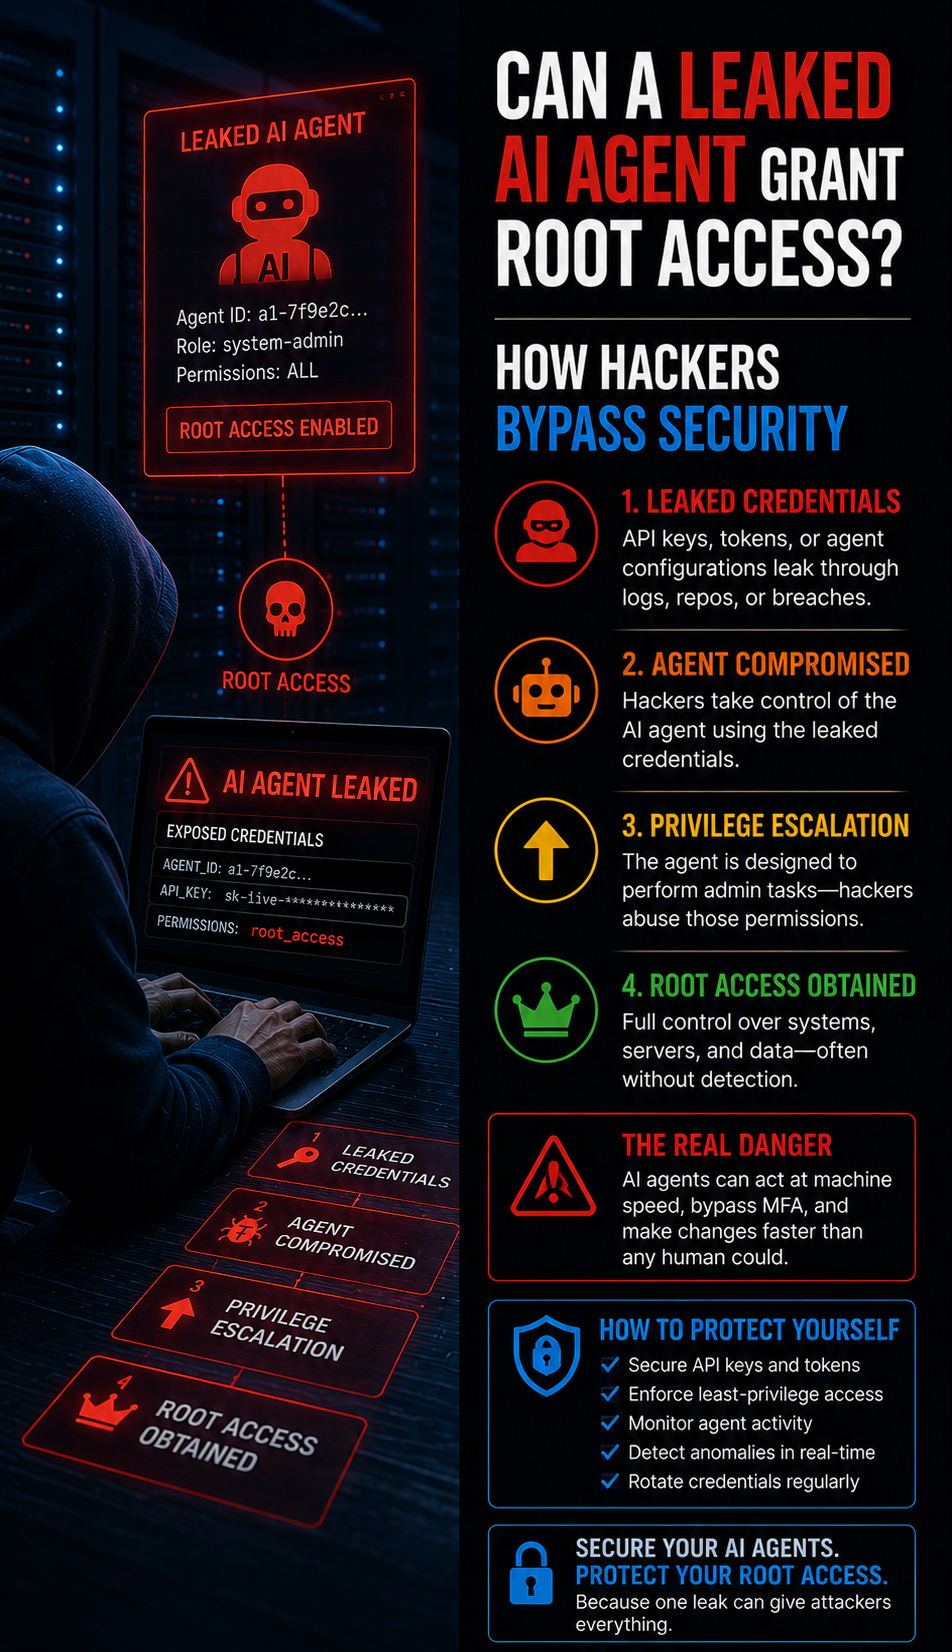
Can a Leaked AI Agent Grant Root Access? How Hackers Bypass Security
What You Need to Know: Leaked AI agent source code grants hackers root access by…
April 14, 2026
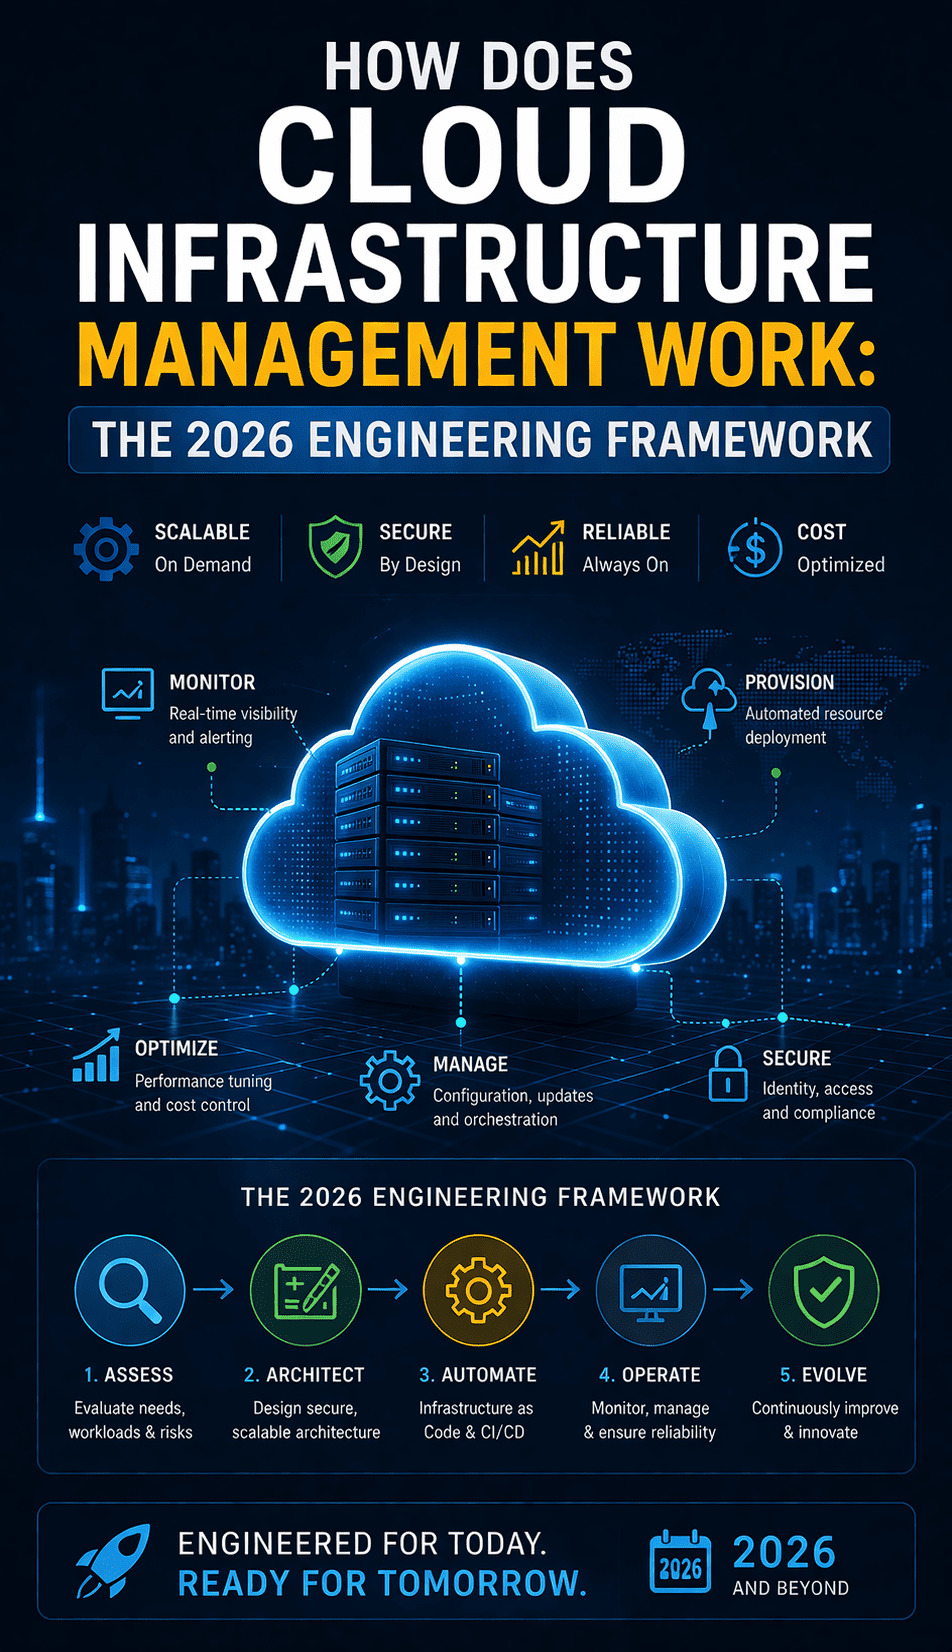
How Does Cloud Infrastructure Management Work: The 2026 Engineering Framework
Summary: Cloud infrastructure management works by utilizing a centralized software layer to orchestrate, monitor, and…


